Cardano has been one of the weakest large-cap coins this month. The Cardano price has dropped almost 30% over the past 30 days and nearly 26% since November 11. This drop pushed ADA toward the lower support of its falling wedge, a structure that usually leans bullish but can turn long-term bearish if broken.
Even with this pressure, three important indicators have turned positive just as Cardano sits on its last major support.
Sponsored
Sponsored
Early Signs of Buyer Strength Near Last Support
Two indicators that track buying strength and volume behavior have shifted at the same time, right as the Cardano price reached the critical $0.45 support.
The CMF (Chaikin Money Flow) tracks whether money is flowing in or out based on price and volume. It had been falling since November 10 and even dropped under zero during Cardano’s sharp correction. But from November 16 to November 19, CMF formed a higher high while the price made a lower high. This is a bullish divergence because CMF rising while price weakens shows stronger inflows than the chart reflects.
Want more token insights like this? Sign up for Editor Harsh Notariya’s Daily Crypto Newsletter here.
On-Balance Volume is a simple way to see if buyers or sellers have been more active. OBV had been stuck under a downward trend line for weeks, matching the steady decline in Cardano price. But as ADA touched the $0.45 zone, OBV pushed above this trend line for the first time in a while. This usually shows buyers starting to participate again before the ADA price reacts.
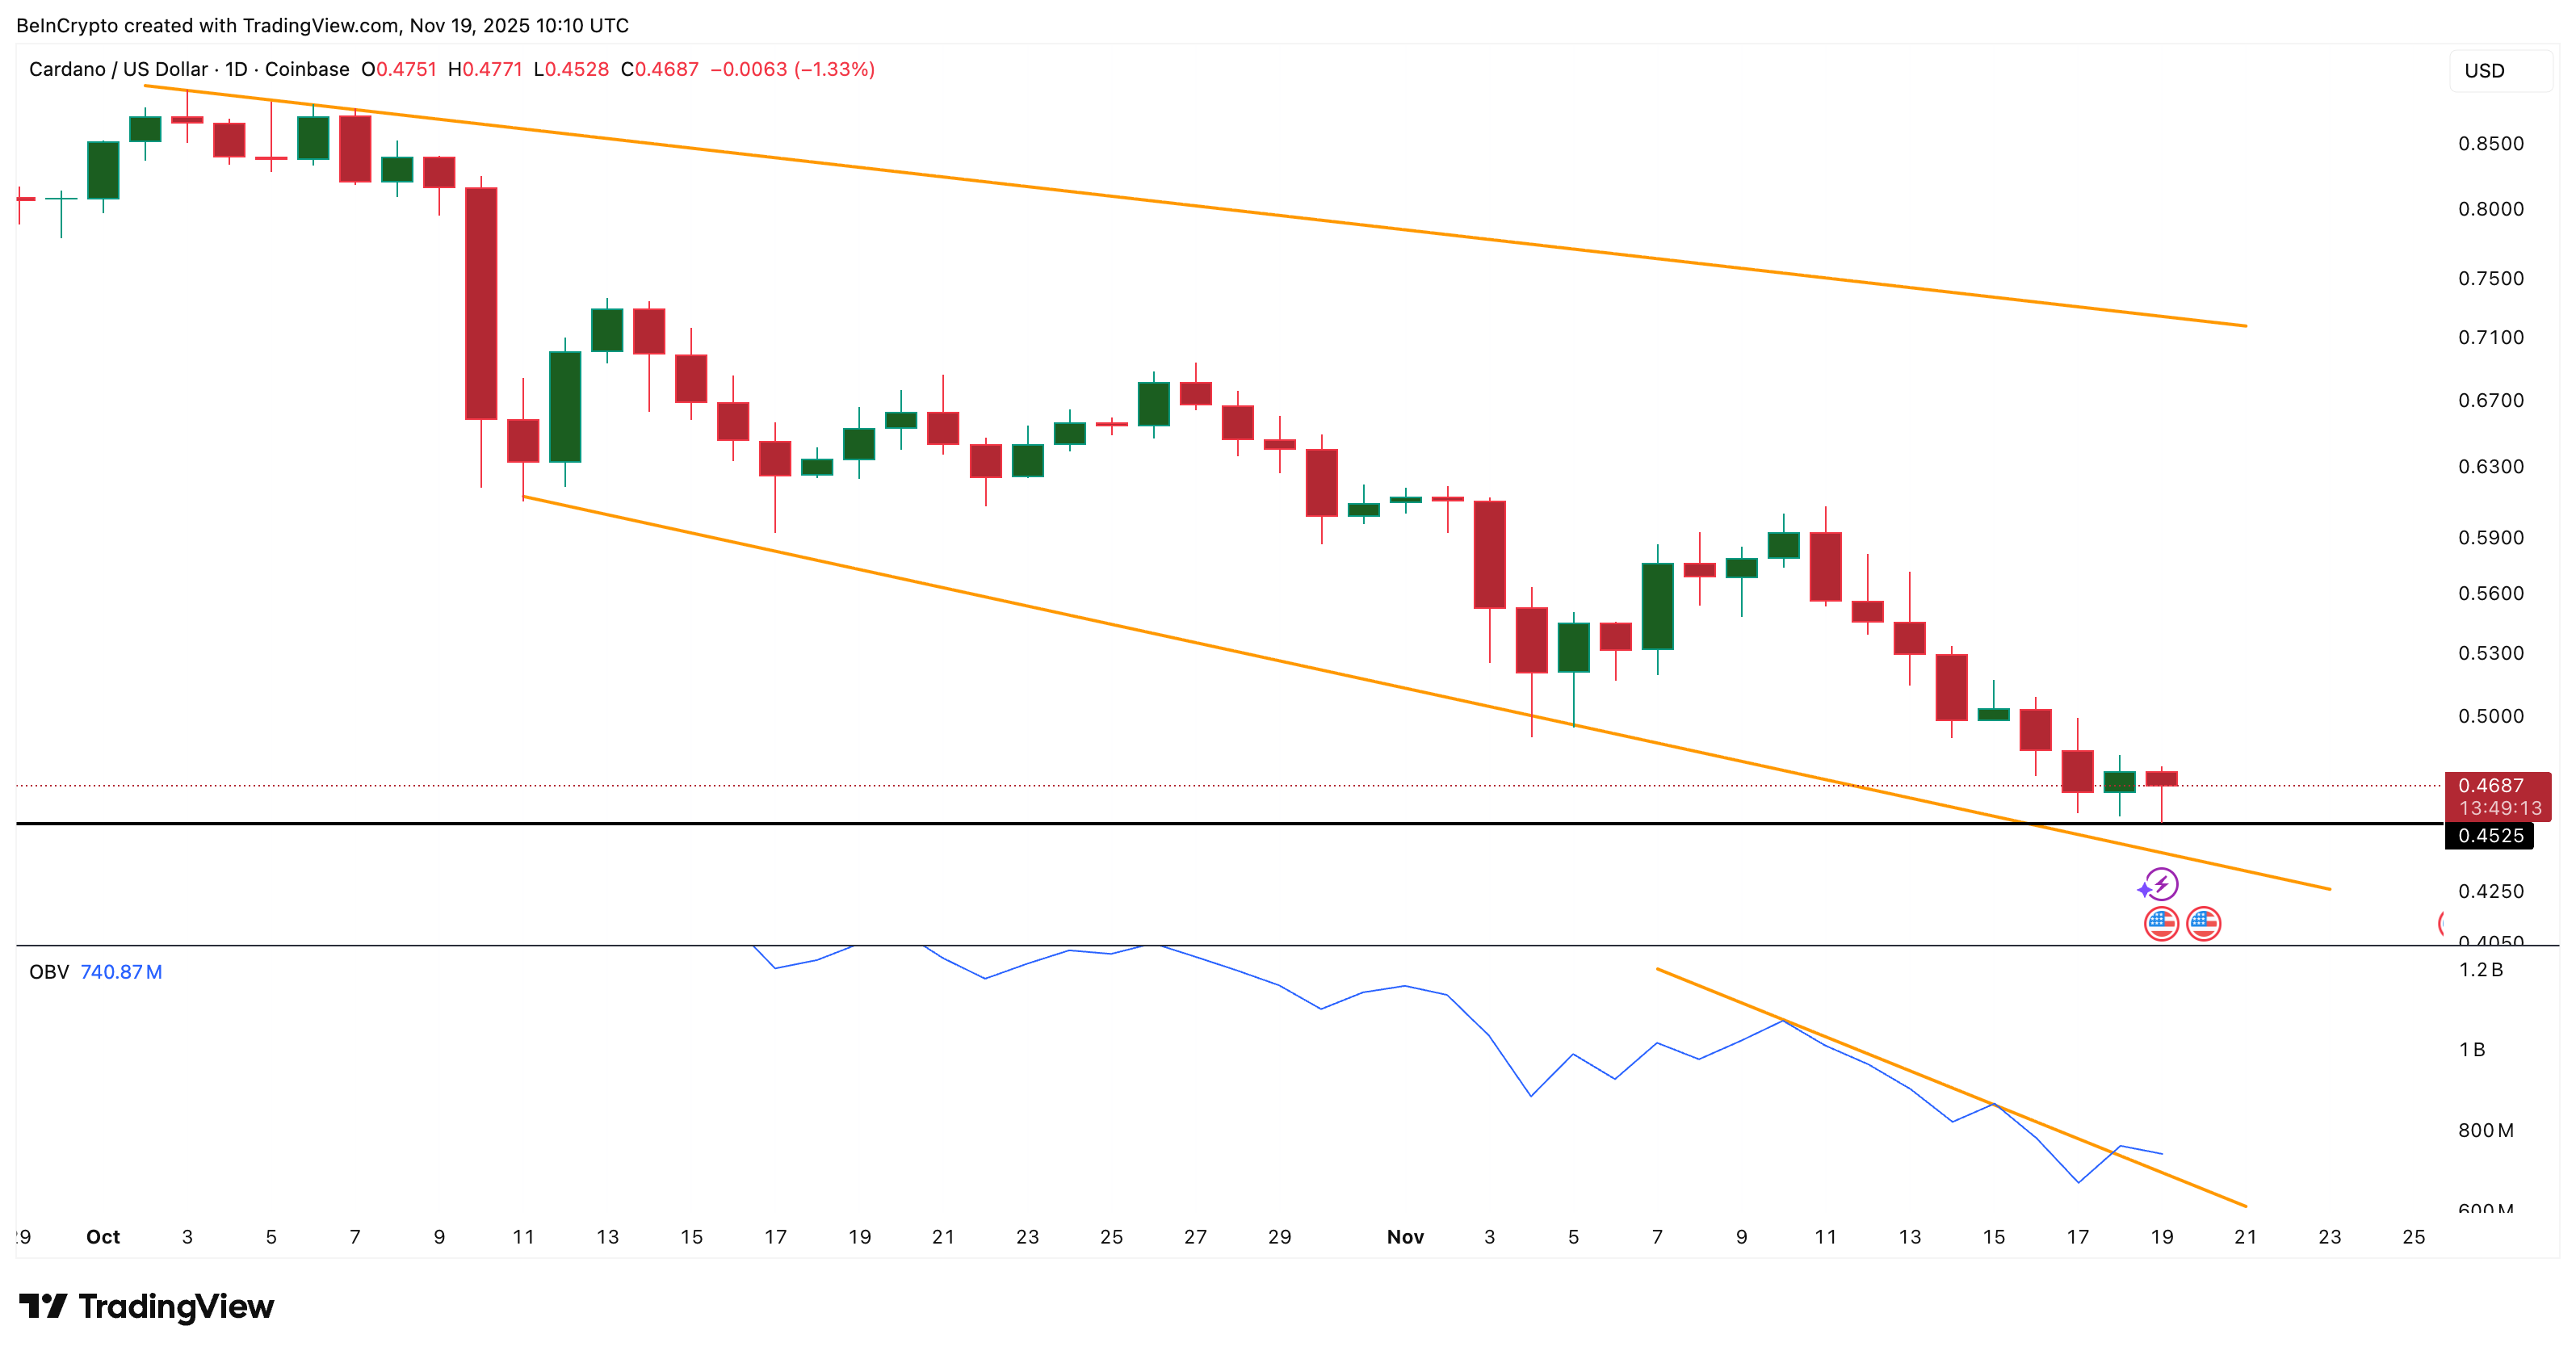
When CMF and OBV improve together near a major support, it often means the market may be preparing for a short-term recovery attempt. But the Cardano price still needs validation from its on-chain behavior.
Sponsored
Sponsored
Holder Behavior Shows Strong Conviction During the Drop
The Spent Coins Age Band tracks how many tokens from different wallet age groups are being moved. When many coins move at once, it often signals fear or heavy selling. When token movement drops while prices fall, it usually shows conviction from long-term holders.
On November 1, ADA saw its spent coins activity peak with the movement of 159.01 million tokens. By November 19, the metric had dropped by roughly 27%, even though the price kept falling.
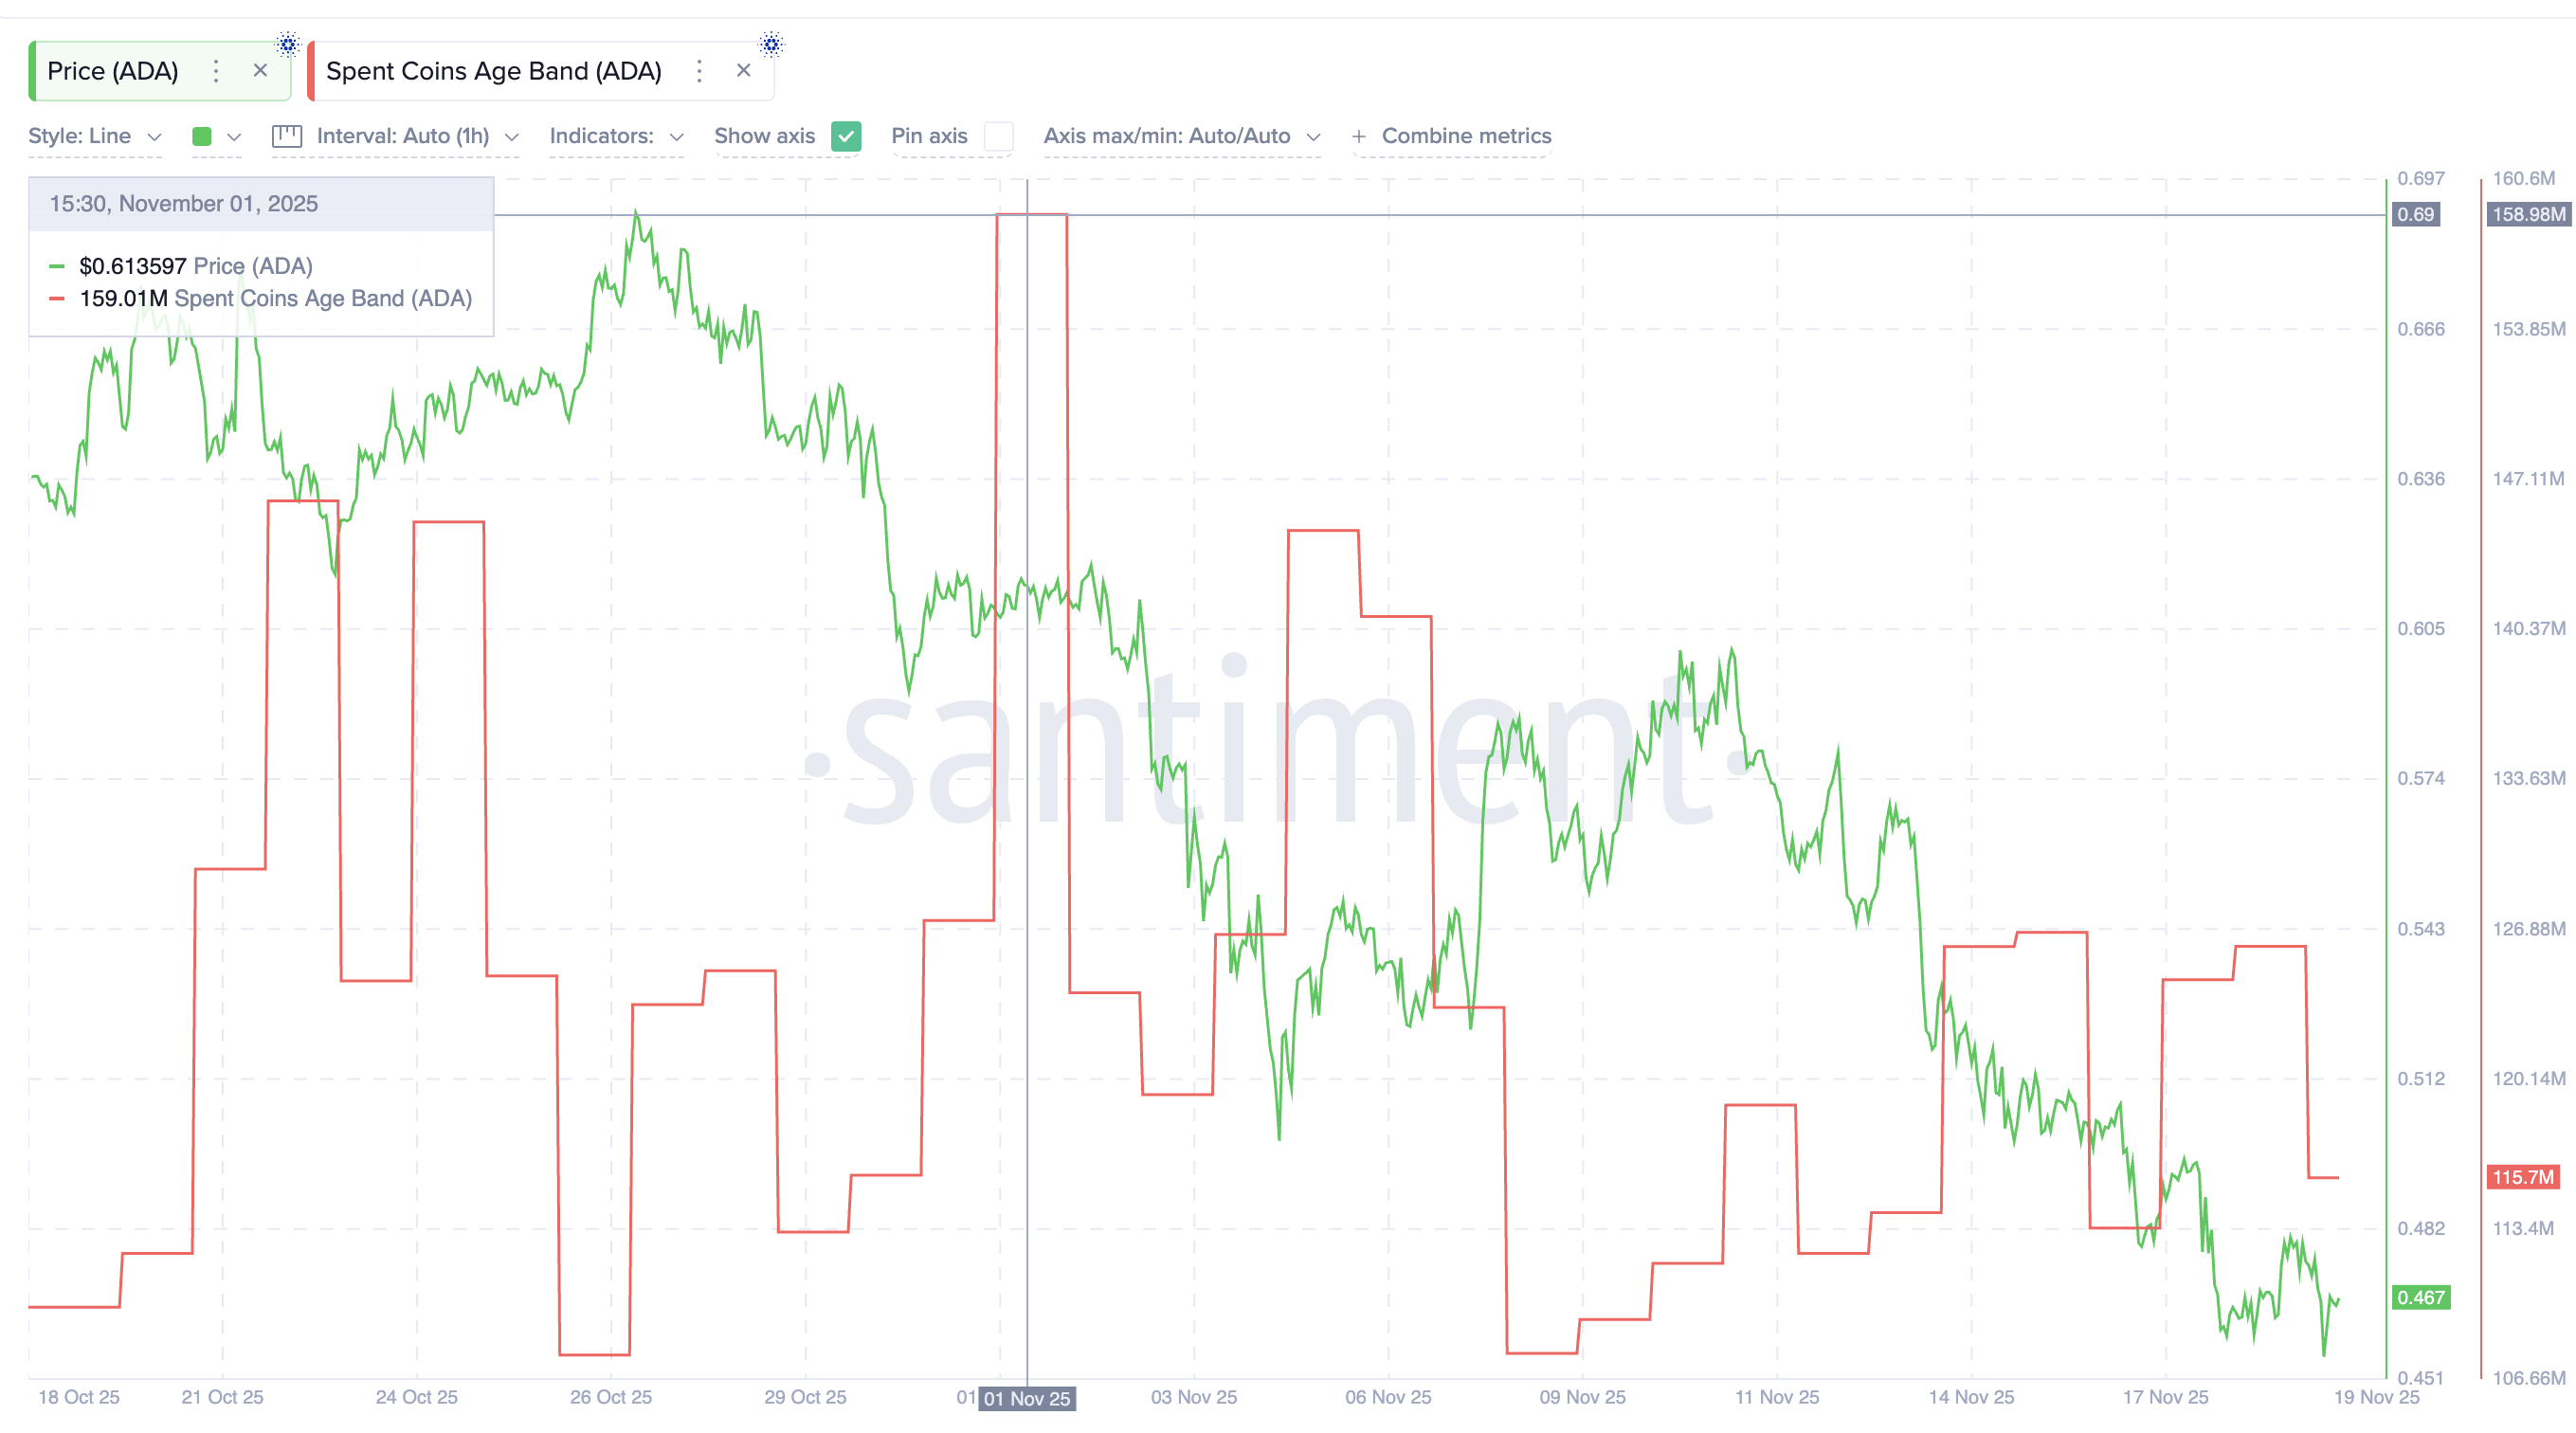
This means far fewer tokens moved during the correction. When token movement drops this sharply during a sell-off, it strengthens the idea that Cardano may be trying to save its trendline support rather than break below it. That’s the third reason pushing for the rebound angle.
Cardano Price Must Hold $0.45 or Risk a Breakdown
Cardano price is trading directly on the lower trend line of its falling wedge and its strongest support at $0.45–$0.44. If this zone holds on a daily close, ADA can attempt a rebound. Moving above $0.50–$0.52 would be the first sign of strength, but the real recovery begins only after Cardano retakes $0.60.
That level flips the short-term trend and sets up a retest of $0.69, which is the point where a full wedge breakout becomes possible. Crossing that level would mean that the Cardano price could turn its supposed rebound into a rally attempt.
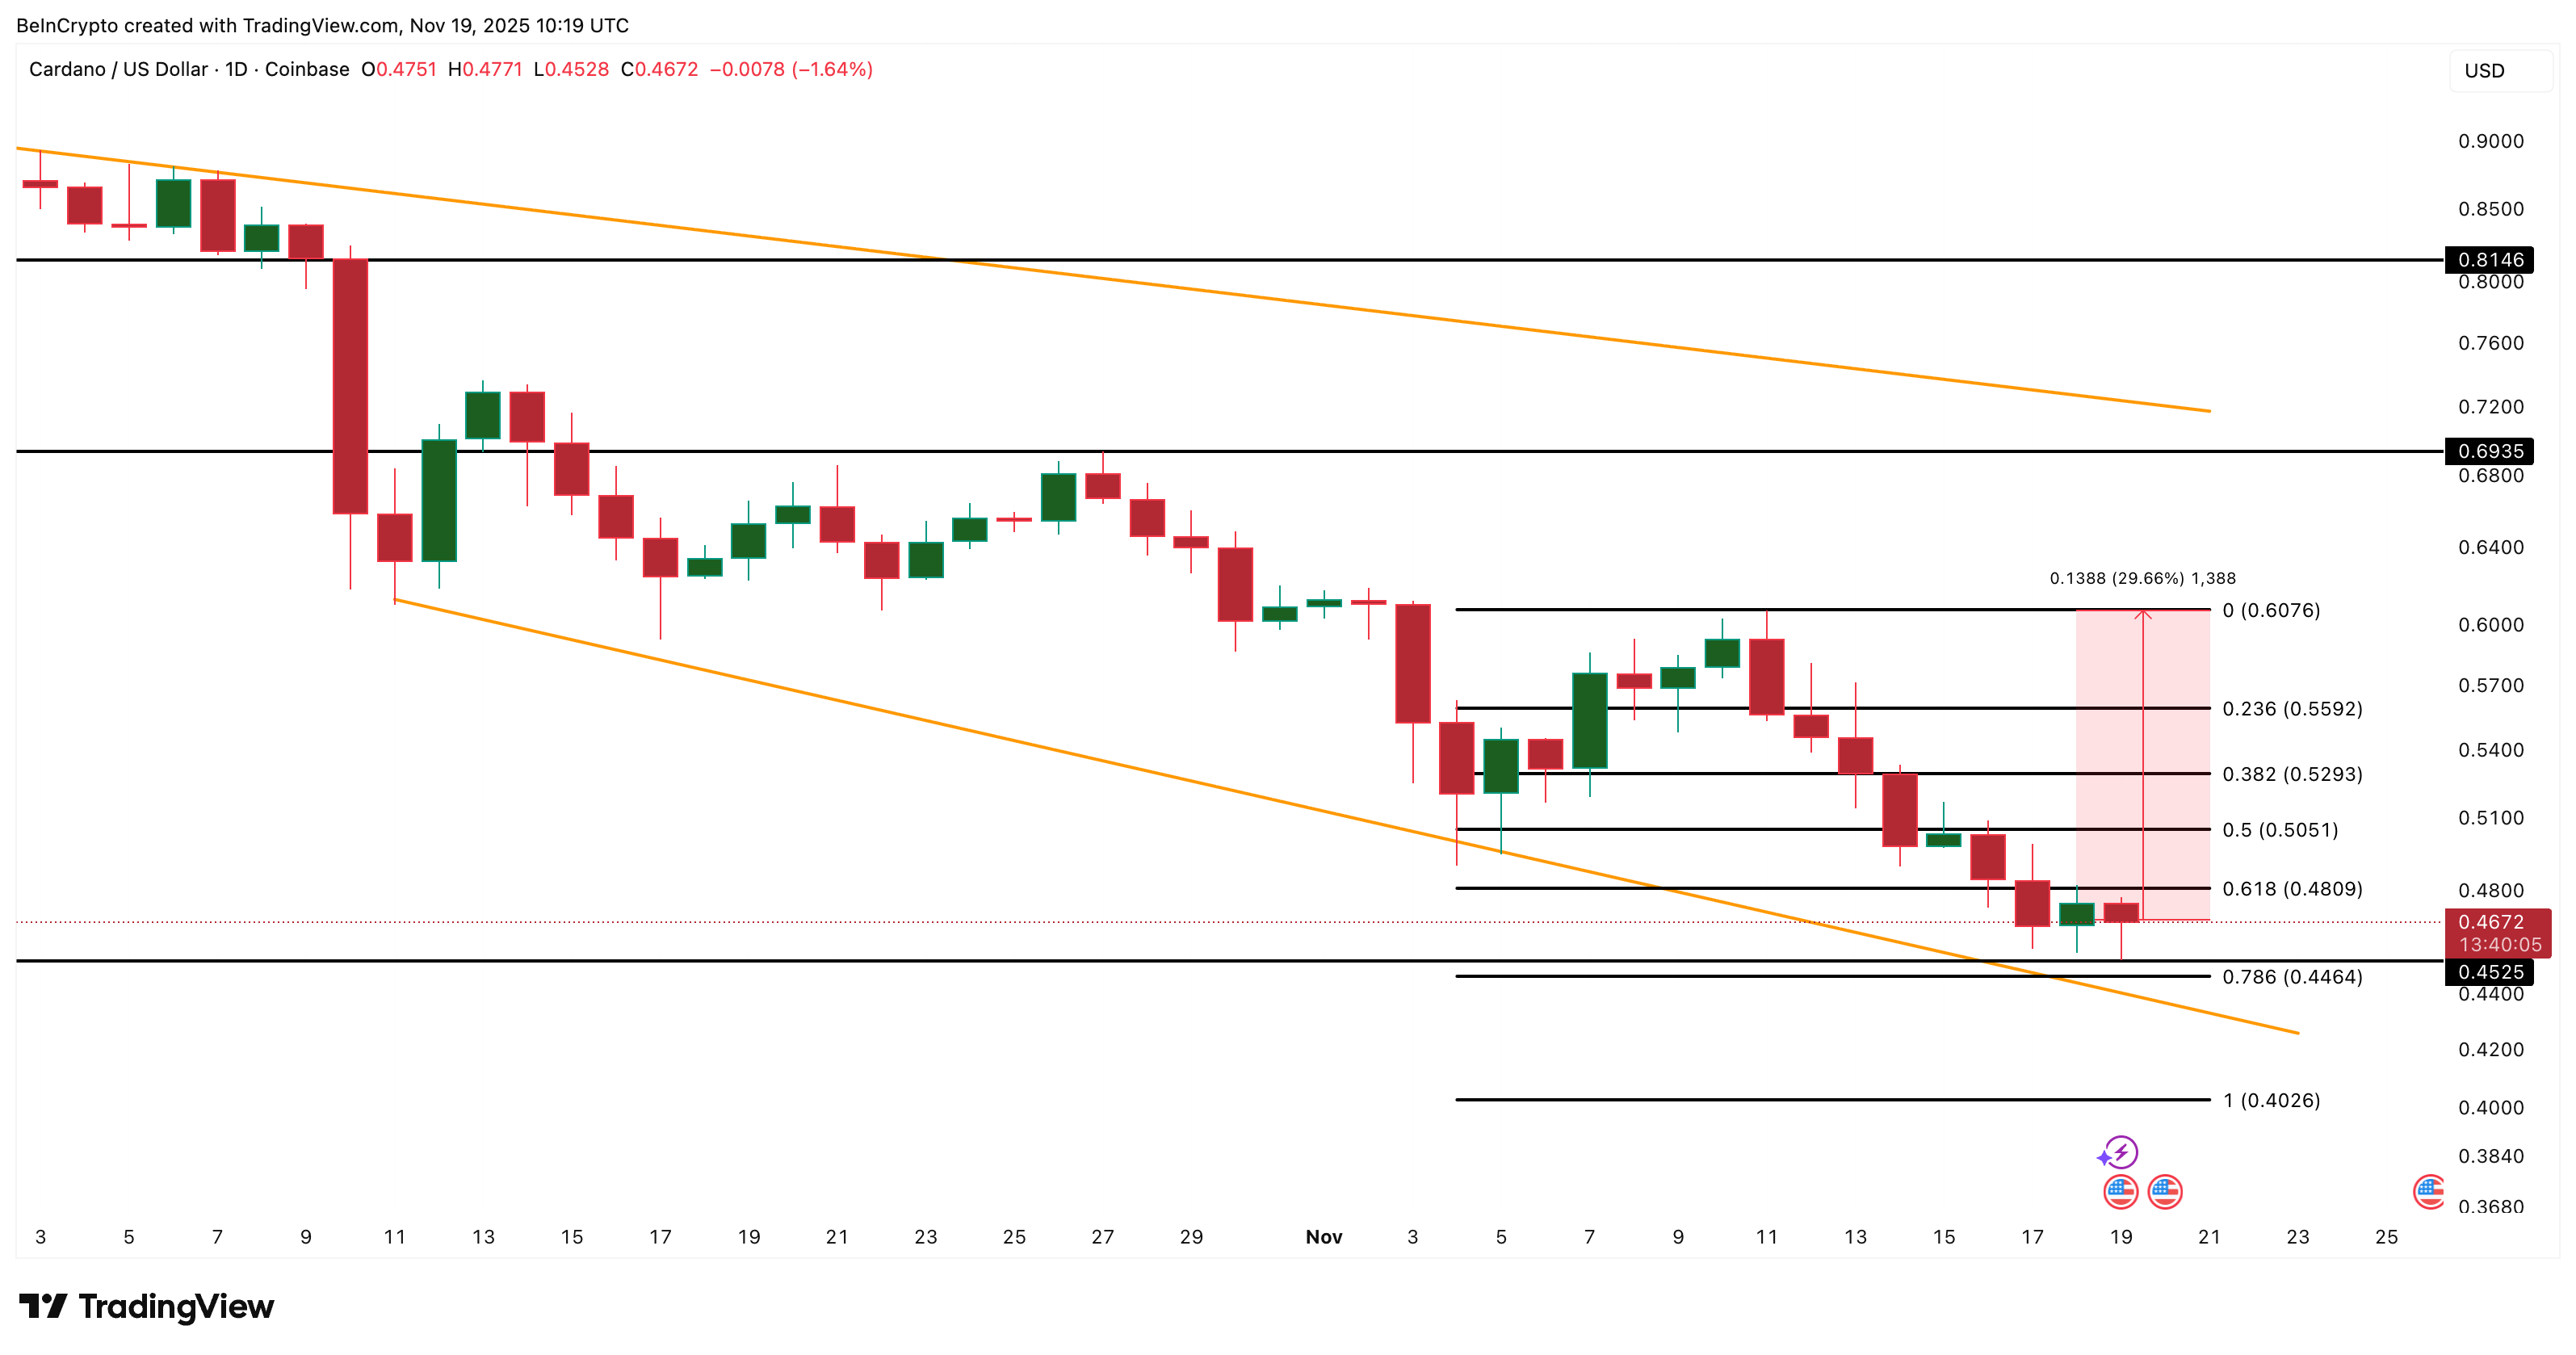
If the support fails, the structure breaks. A daily close under $0.44 opens a drop toward $0.40, with the possibility of deeper dips if market sentiment weakens further. The bullish setup becomes invalid below this zone.