Table of Links
Abstract and I. Introduction
II. Approach
A. Architectural Design
B. Proof of Concept Implementation
III. Envisioned Usage Scenarios
IV. Experiment Design and Demographics
A. Participants
B. Target System and Task
C. Procedure
V. Results and Discussion
VI. Related Work
VII. Conclusions and Future Work, Acknowledgment, and References
A. Participants
We invited students of Kiel University that attend the Bachelor’s or Master’s program in computer science to participate in our user study [31]. The participation was voluntary. All participants could sign up for random group assignment or participate with a fellow student. Each group had the chance to win two out of ten 100 C gift cards for an e-commerce shop [32].
Distribution: The conducted user study included seven groups with two students each. The number of participants is therefore slightly larger than the median participant count (thirteen) in the related literature body [27], but too small to

be effectively used in a controlled experiment [29], [33]. With the exception of one group, all other participants within their group knew each other. Five students attend the Master’s program, the remaining students are undergraduates in computer science. All participants reported that they intend to become professional software developers.
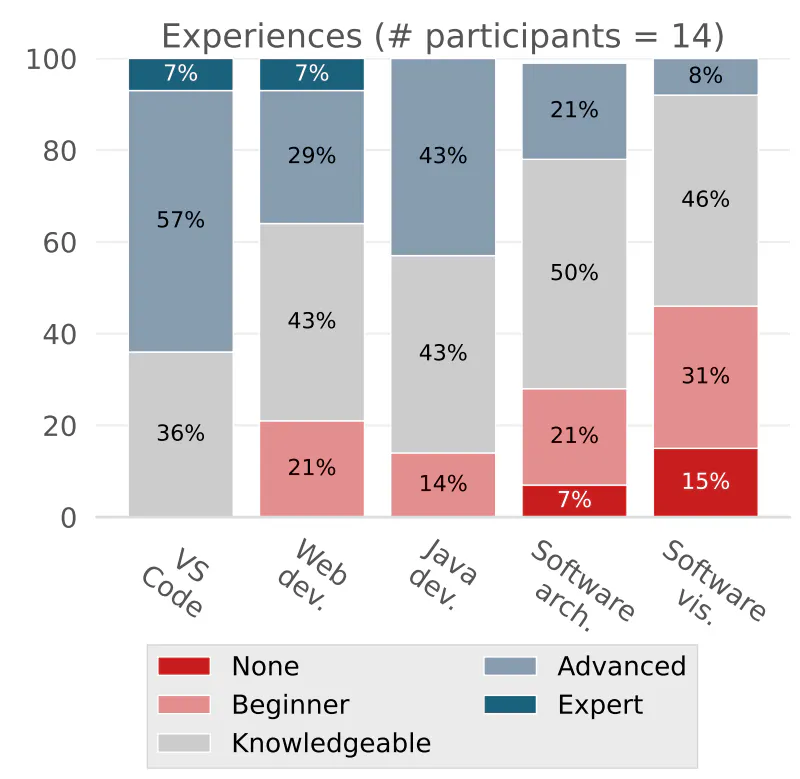
Experiences: Figure 3 shows participants’ reported experiences with software development based on work experiences. The two students who indicated they had no experience are in the undergraduate program, and one of them also indicated (as only person) that the decision to become a software engineer is not final. The remaining twelve participants have either gained experiences while working as student employee or in private software development. Three participants are additionally involved in open source development. Figure 4 shows the results of various experiment-related aspects that were asked. All participants stated that they have knowledgeable or even better experiences in VS Code. Three persons rate their web development and software architecture experiences at beginner level. One of the participants with no software engineering work experience reported to have no experience in software architecture. Overall, the distribution of experiences match the courses of study, since SVs are often treated as seminar papers in the master’s program, for example. However, we probably also see overestimation such as the persons that stated to be at expert level for VS Code and web development, as well as half of the participants stating to have at least knowledgeable experiences in SV. In this context, half of the participants have used ExplorViz at least once in the past. The participants of three groups each have different experiences with ExplorViz.
B. Target System and Task
ExplorViz’ SV visualizes a software system’s runtime behavior. However, it is not limited to application tracing of monolithic software systems, but also supports distributed tracing,6 e.g., network requests between applications that use distributed architectures. Since distributed software systems are pretty common nowadays, we incorporated this fact in our experiment. To achieve that, we used the distributed version of the Spring PetClinic7 as target system for the experiment. As done in the past [16] we recorded traces during the execution of use cases within the PetClinic. For the experiment, these were then provided as so called snapshots, i.e., aggregated runtime behavior, to the Frontend, resulting in a structural, ‘static’ SV of dynamic runtime behavior. We decided against using multiple snapshots so as not to overwhelm new users with the amount of features. However, this can be seen in the supplementary video of this work. The participants explored the target system by means of its source code as well as embedded SV and were asked to solve two tasks.
Table I depicts the program comprehension tasks that all participants had to solve during the experiment. We did not use metric analysis tasks such as ‘find the class with the

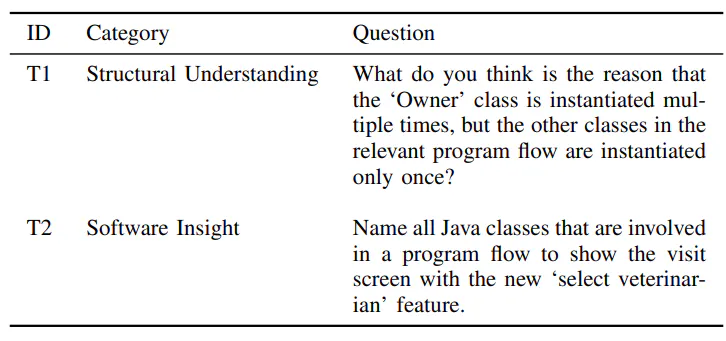
highest instance count’. Instead, the chosen tasks instructed the participants to structurally comprehend the software and find analogies based on the depicted runtime behavior. Therefore, the tasks of the experiment refer to a scenario as presented in SC1, i.e., a guided, task-oriented introduction for onboarding. With the focus on SC1, we intend to investigate both the noncollaborative and collaborative onboarding process. Therefore, T1 had to be solved alone and served as an introduction to both the target system and the use of our approach. T2 introduced the collaborative features, e.g., shared SV and synchronized text selection events, and asked the participants to work together.
C. Procedure
In the following, we present the experiment’s procedure. For additional information, we refer readers to the second prepared video8 that demonstrates an exemplary experiment run. Overall, the experiment is divided into pre-questionnaire, mid-questionnaires, i.e., questions that had to be solved after each task completion, and post-questionnaire.
The user study took place at Kiel University and included one instructor who also co-authored this paper. The instructor designed and implemented the approach as well as conducted the user study. Although our approach can be used remotely, we decided to have the study take place in one locality, so that the instructor could intervene if necessary. In each experimental run, the participants were first informed about the data that would be recorded and used for publication. After signing a consent form, the instructor gave a brief introduction to VS Code and the embedded SV. It was mentioned that all introduced features were additionally described on a cheat sheet, which was placed on the table in front of the subjects. Afterwards, the participants were told to openly ask questions if they had a problem. Furthermore, they were told that they could pause or abort the experiment at any time. They draw their login token for the survey tool LimeSurvey9 and started with the pre-questionnaire. Then T1 was introduced and all participants were redirected to browser-based VS Code instances by clicking a button inside of the LimeSurvey form. Each VS Code instance was specifically prepared for a given task and ready to use. It did not require any setup, so that the participants could completely focus on the task itself. They began by reading a markdown file that introduced the target system, controls, and the task itself. After answering T1 in LimeSurvey, all participants gave their feedback to the just used approach. T2 was introduced in the same way as T1. However, here participants were instructed to test the collaborative features first and then work together on solving T2. Again, the subjects gave their feedback and concluded with the post-questionnaire. During each experiment run, the instructor made a note of noticeable mentions stated by the participants.
Authors:
(1) Alexander Krause-Glau, Software Engineering Group, Kiel University, Kiel, Germany ([email protected]);
(2) Wilhelm Hasselbring, Software Engineering Group, Kiel University, Kiel, Germany ([email protected]).