Binance Coin (BNB) is once again in the spotlight, and for good reasons. In recent days, the price has gained momentum, drawing an increasingly evident bull trend on the chart.
After weeks of consolidation, the market seems to have regained confidence, and this movement has not gone unnoticed among traders and investors.
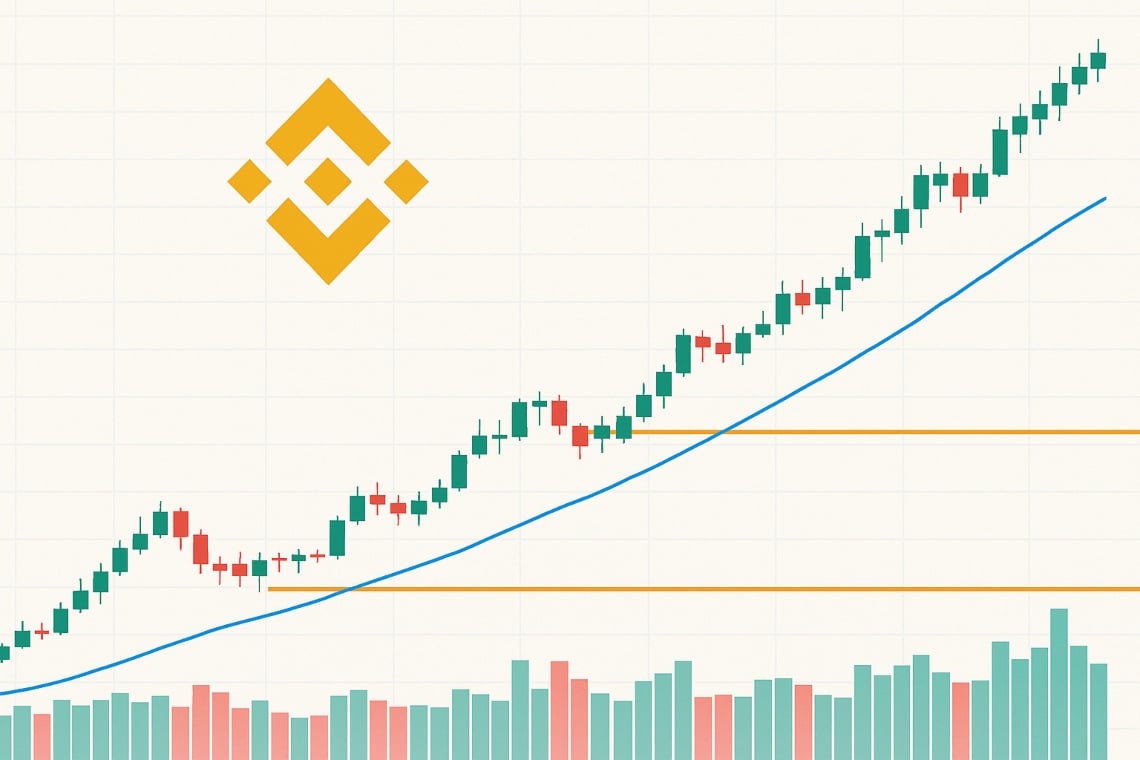
Let’s see together what the 4-hour chart of BNB/USDT tells us, what the most interesting signals are, and what to expect in the short term.
The trend is bull for BNB, and it’s not just an impression
Looking at the last closing, BNB is at 762.27 dollars, close to the intraday high of 764.21. A result that confirms a steady progression that started several weeks ago.
Two numbers immediately help to understand the direction of the market:
- The 50-period exponential moving average (EMA50) is at 729.91 dollars.
- The EMA100 is lower, at 707.61 dollars.
The price has been above both averages for days, and their upward slope indicates that the trend is solid. In practice, as long as BNB stays above these two lines, the buyers continue to call the shots.
Another interesting signal comes from the Bollinger Bands. After a long phase of relative calm, the bands have widened and the price is now moving near the upper part of the channel. This tells us two things: volatility has increased and the crypto market is in a bull phase.
However, there is an aspect not to underestimate. When the price gets too close to the upper band (which in this case is at 777.72 dollars), it is a sign that we might be close to a short pause or a retracement.
It is not a reversal signal, but a warning bell that invites caution.
Another positive element is the growth in volumes. In the last session, over 25,000 contracts were exchanged, a figure higher than the average of the previous weeks.
An increase in volumes during a rising phase indicates that it is not just a flash in the pan: the market is actively participating in this movement.
Momentum: good but with some signs of slowing down
The momentum indicators complete the picture and help to read between the lines.
The 14-period RSI indicates 61.51. A level that confirms the positive momentum, without showing the typical signs of a “tired” market (which usually appear when the RSI exceeds 70).
This suggests that BNB might still have room to rise, although an approach to the overbought threshold in the coming sessions should be monitored closely.
The MACD is positive: the main line (12.45) remains above the signal (11.84) and the histogram is still green.
However, the histogram shows a slight contraction, indicating that the momentum might be starting to lose a bit of strength. Nothing concerning for now, but it is a signal to keep an eye on in the coming days.
As always, it is useful to identify the levels that can make the difference in the coming hours and days.
- Important resistance: 777–780 dollars. Here the price might pause to reflect before attempting a new high.
- First support: 750 dollars. A nearby level that could attract new buyers if the price were to drop slightly.
- Intermediate support: 730 dollars, in line with the EMA50, a fundamental level to keep the bull trend intact.
- Long-term support: 707 dollars, in line with the EMA100. A drop below this level would change the scenario more substantially.
The break of the resistance at 780 dollars, especially if accompanied by a further increase in volumes, could pave the way towards the 800 mark and perhaps even beyond.
The underlying trend, as long as the moving averages remain tilted upwards and the price stays above the EMA50, remains favorable.
If, however, the resistance at 780 proves difficult to overcome and the MACD starts to indicate weakness, we might witness a physiological retracement towards 750 or 730 dollars.
Even this scenario, however, would still fall within a bull context as long as prices remain above 707 dollars.
For those who are already in and for those who are waiting
Those who are already positioned long can start protecting profits, perhaps by raising stops below 730 dollars.
Those who are waiting for an opportunity might consider two strategies: an entry in case of a breakout above 780, or wait for a pullback towards 730 to seek a better price.
The technical analysis of the BNB/USDT exchange rate on the 4-hour chart tells the story of a healthy market, with a well-structured bull trend, increasing volumes, and still positive momentum.
However, there are signals that invite caution: a test of the resistance at 780 and a slight slowdown of the MACD require attention.
At this moment, discipline is essential. Being ready to seize opportunities without neglecting risks is the key to navigating such a dynamic market.
What do you think? Are you more inclined to believe in a continuation towards new highs or do you expect a pause in the coming sessions? Write it in the comments or share your strategy: the discussion always helps to see the bigger picture.