Table of Links
Abstract and 1. Introduction
2. Data and Methodology
2.1 Bubble Timestamping
2.2 Cryptocurrency-LAND Wealth Effect
3. Results
3.1 Bubble Timestamping
3.2 Cryptocurrency-LAND Wealth Effect
3.3 Granger Causality Test
4. Conclusion and References
Appendix: Bored Ape Yacht Club’s Otherside
3. Results
3.1 Bubble Timestamping
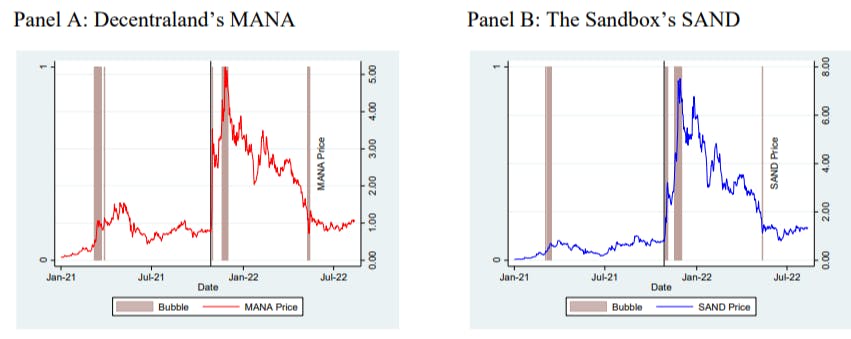
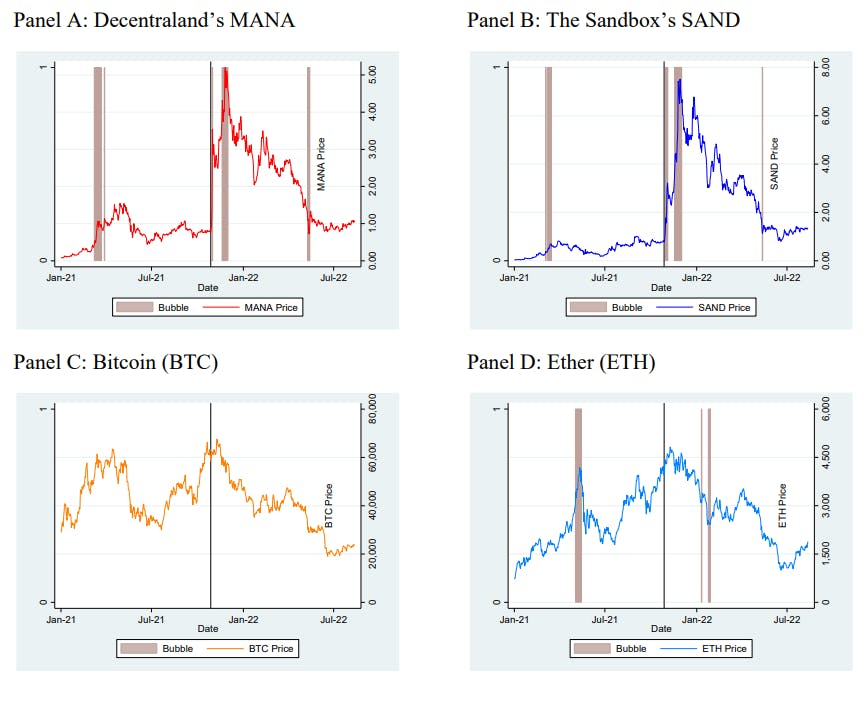
First, we demonstrate the existence of bubbles using the PSY algorithm in MANA and SAND. The daily time series of cryptocurrency prices and phases of explosive bubbles between January 1, 2021, and August 12, 2022 are displayed in Figure 1. The vertical line in each panel corresponds to the October 28, 2021, when Facebook announced its decision to change its name to Meta, underpinning its interest in metaverse. During this period, MANA and SAND prices increased by 28.6 and 287.5 times respectively, and much of the increase occurred after the announcement. The PSY algorithm identifies at least 10 of the days between the announcement and the end of November 2022 as bubble. The result is similar to Philippas et al. (2019) who document BTC price jumps following arrival of signals derived from Twitter and Google Trends. During this period, 5.6% and 5.3% of the days are identified as bubbles for MANA and SAND, while BTC is never identified as in a bubble, and ETH identified as bubble 3% of the days, albeit in different periods from MANA and SAND. This evidence shows that the MANA/SAND bubble is related to the interest in metaverse.
The result on bubble identification highlights an interesting aspect of the PSY algorithm. Shahzard, Anas and Bouri (2022) use a slightly different version of the algorithm and 4-hourly price data between January 1, 2020 to June 18, 2021 to investigate the impact of Elon Musk’s tweets on Bitcoin and Dogecoin prices. While our analysis does not indicate a presence of bubble in BTC, their analysis identifies multiple episodes between January and April – often lasting several days – as bubbles. The inclusion of data from 2021 and analysis of higher frequency data will likely affect our results and more periods may be identified as bubbles, but the key insight from our analysis is that the metaverse bubble is not related to general market movements. Thus, early buyers of MANA and SAND are beneficiaries of this bubble.

3.2 Cryptocurrency-LAND Wealth Effect
The explosive increase in metaverse cryptocurrencies coincide with the increase in LAND NFT prices. We estimate the HPI (base = 1) for LAND in Decentraland and The Sandbox and report the summary statistics of the HPI and corresponding cryptocurrencies at weekly frequency in Table 3. In figure 2, we plot the weekly HPI level (bar) against its cryptocurrency price (line). The plots show a very strong co-movement: weekly LAND-MANA correlation is 0.9870 and the LAND-SAND correlation is 0.9684. Both MANA and SAND are highly correlated (0.9675), and so are their HPI (0.9463). Because of this strong correlation, if the cryptocurrencies are considered to be in a bubble, then so can the metaverse real estate.


The wealth effect in our research design corresponds to cryptocurrency price leading LAND price. We begin by analyzing the lagged correlation between the price levels, a method often used in price-volume correlation and bubble research (e.g. DeFusco, Nathanson and Zwick, 2022; Liao, Peng and Zhu, 2022; Pénasse and Renneboog, 2022).[7] The idea is that correlation between current level of HPI and the lead (negative number) or lag (positive number) cryptocurrency prices can indicate the direction of the relationship. If cryptocurrency price leads LAND price, correlation should be higher for lag and decays more slowly as lag increases. Thus, the lefthand side should be lower and steeper. Figure 3 plots the correlations at weekly frequency for up to 10 weeks. The results indicate that cryptocurrency prices lead LAND prices for both Decentraland and The Sandbox, consistent with the wealth effect prediction.


Author:
(1) Kanis Saengchote, Chulalongkorn Business School, Chulalongkorn University, Phayathai Road, Pathumwan, Bangkok 10330, Thailand. (email: [email protected]).