
Kaspa price been climbing again, now sitting around $0.098 after a nearly 5% jump in the past day. What’s interesting is that trading volume actually dropped by 8%, meaning there’s less activity but buyers are still stepping in.
Moreover, a lot of this spike is tied to the upcoming “Kaspa Experience” conference in Berlin and renewed attention on BlockDAG tech.
After bouncing off $0.086 earlier this month, KAS price has been grinding higher and is now testing resistance at $0.0985–$0.0990. If it can break above that level, the next stop could be $0.104 and then $0.112.
Let’s take a closer look at what’s going on today.
📅 What We Got Right Yesterday
Yesterday we talked about how $0.10 would be the key level to watch for a bigger push higher, and that $0.092 was the first support to look at if momentum slowed down.
So far, price has stayed well above $0.092 and kept moving up toward $0.099. We haven’t seen that clean break above $0.10 yet, but the uptrend is still alive with higher lows holding strong.
📊 Kaspa Daily Overview (August 10)
- Current Price: $0.09809
- 24h Change: +4.98%
- Hourly RSI (14): 60.77 — momentum is building but not overbought
- Volume: Down 8%
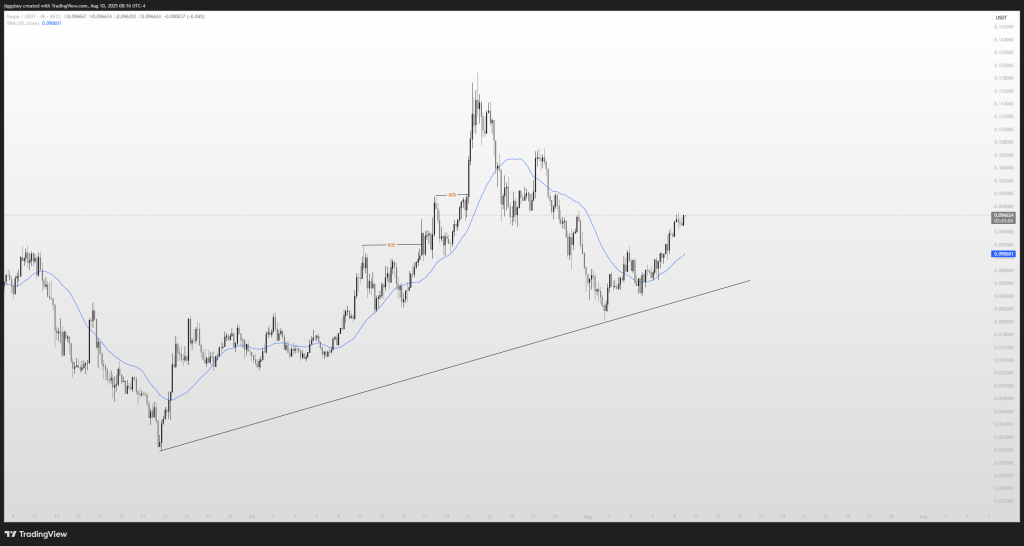
Kaspa chart still shows an uptrend, with price sitting above both the 50-period SMA and the rising trendline around $0.087. The next test is getting through $0.10 without rejection.
Read Also: Why Ripple (XRP) Could Become Most Important Asset of the Decade
🔍 What the Kaspa Chart Is Showing
On the 4H chart, KAS price has been making steady higher highs and higher lows since mid-June. Two Break of Structure points confirm buyers are still in control. After a pullback in late July, the market found its footing and started climbing again.
Right now, $0.092 and $0.087 are the key support levels. Above $0.10, resistance lines up at $0.104, $0.112, and that July high of $0.124.
📈 Technical Indicators (Hourly Timeframe)
| Indicator | Value | Interpretation |
|---|---|---|
| MACD (12,26) | 0.001 | Bullish crossover, momentum holding |
| ADX (14) | 25.81 | Trend strength picking up |
| CCI (14) | 227.46 | Overbought, could see a short pause |
| RSI (14) | 60.77 | Bullish but not overbought |
| ROC | 1.43 | Price change supports upside case |
| Bull/Bear Power (13) | 0.0009 | Buyers still have the edge |
Most signals lean bullish, though the high CCI reading suggests we might see a small breather before the next leg up.
🔮 Kaspa Price Prediction Scenarios
Bullish:
A firm close above $0.10 would send KAS to $0.105–$0.110, possibly even $0.112–$0.120 should momentum not fizzle out.
Neutral:
If $0.10 remains a lid, KAS price might chop around $0.085 and $0.10 for a long time.
Bearish:
If price dips below $0.087, it might crash to $0.084–$0.085 and possibly even to $0.080.
🧠 Wrapping Up
Kaspa price is still holding its uptrend and pushing toward the $0.10 mark. Most technical indicators point to more upside, but the overbought CCI hints at a possible short-term pause.
The $0.10 resistance is the main level to watch.A clear break would pave the way for target levels of $0.105–$0.110. If the level is to remain as resistance, the market can trade sideways or fall back to $0.092–$0.087 support levels.
The bulls are currently driving the market, but their next move will depend on the $0.10 area.
Subscribe to our YouTube channel for daily crypto updates, market insights, and expert analysis.

