
Kaspa price is still stuck in a tight range after losing some of that early August momentum. Right now, price action is looking a bit hesitant, bulls just can’t seem to push past that stubborn resistance, and while some indicators are leaning slightly bullish, most are sitting neutral.
After getting knocked back from $0.096 last week, KAS has drifted down to hover just above the $0.090 mark. Buyers are holding that line for now, but it’s clear this level is under pressure.
Let’s break down today’s setup.
📅 What We Got Right Yesterday
In yesterday’s prediction, we pointed out that $0.10 was the big breakout level for Kaspa. We said if it couldn’t get through, the price would probably bounce around between $0.085 and $0.10.
That’s exactly what happened. KAS price never closed above $0.10, and it’s been stuck in that sideways range ever since. Today’s lows are brushing up against the $0.089–$0.090 zone, which is getting dangerously close to that lower boundary we warned about.
We also said a drop under $0.090 could put $0.085 in play, and right now, that’s still on the table.
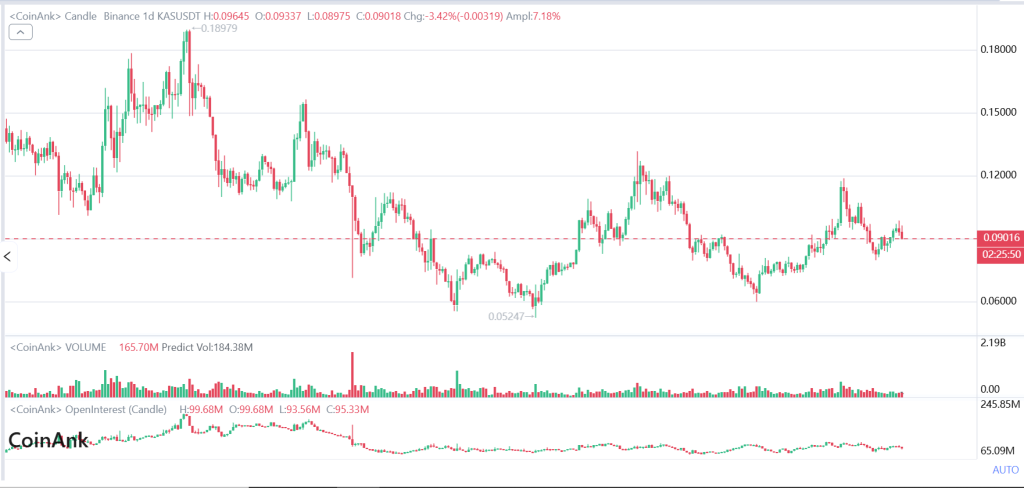
📊 Kaspa Daily Overview (August 12)
- Current Price: $0.09012
- 24h Change: -3.42%
- Volume: 165.7M (predicted 184.3M)
The $0.090 level is acting like a pivot point right now. Sellers keep KAS price locked below $0.096, and buyers are digging in at support. The overall uptrend from $0.052 is still alive, but momentum has slowed down a lot.
🔍 What the Kaspa Chart Is Showing
The daily KAS chart makes it clear: $0.096–$0.098 is a wall. Every rally over the past week has hit it and bounced back.
On the flip side, $0.090 is still holding as support. Lose it, and we could be heading for $0.077–$0.085. Break above $0.096, and the next stops are $0.118–$0.120.
Volume’s quieter than it was during past breakouts, which tells me traders are waiting for a real move before committing.
📈 Daily Technical Indicators
| Indicator | Value | Signal |
| RSI (14) | 50.78 | Pretty balanced, no strong momentum either way |
| ADX (14) | 30.20 | Trend strength leans slightly bullish |
| MACD (12,26) | 0.002 | Early signs of bullish momentum |
| CCI (14) | 42.09 | Neutral zone |
| Ultimate Oscillator | 50.92 | Balanced across timeframes |
| Bull/Bear Power (13) | 0.0013 | A tiny edge for the bulls |
Read also: Kaspa Price Enters a Decision Zone as Exchange Supply Shrinks – Here’s What the KAS Chart Reveals
🔮 KAS Price Scenarios
Bullish:
Close above $0.10 and we could see $0.105-$0.110, maybe even $0.118-$0.120 with enough volume.
Neutral:
Keep failing at $0.10 and KAS price probably stays stuck between $0.085 and $0.10.
Bearish:
Drop under $0.087 and $0.084-$0.085 becomes the target, with $0.080 not far behind if selling ramps up.
🧠 Bottom Line
Kaspa price is trading right at a make-or-break level. Get above $0.096–$0.10, and bulls have room to run. Lose $0.090, and the chart starts tilting bearish. Until one of those breaks, it’s just a waiting game for the next big move.
Subscribe to our YouTube channel for daily crypto updates, market insights, and expert analysis.

