XRP price is still stuck in a tight range after cooling off from its July rally. The momentum has faded, sellers are pressing harder, and the token is hanging right above a key support zone.
After peaking at $3.66 in July, XRP has pulled back and now trades around $2.86. The big question for traders today is whether that support can hold or if the market is gearing up for another leg lower.
Let’s break down what’s happening.
📅 What We Got Right Yesterday
In yesterday’s prediction, we talked about how important the $2.75 level is. We noted that if the XRP price slipped under it, the next stop could be $2.60 or even $2.45–$2.50.
So far, the bulls have managed to defend above $2.86, which means price is still moving in the expected range between $2.85 and $3.10. No breakout yet, and volume is still thin, which tells us the market hasn’t chosen a direction.
We also said that only a move back above $3.18-$3.25 with real volume could unlock a push toward $3.35 and maybe $3.55-$3.70. That hasn’t happened yet.
📊 XRP Daily Overview (August 22)
- Current Price: $2.86
- 24h Change: -0.54%
- RSI (14): 42.16
- Volume: Still fading
Right now, XRP price is hovering at the bottom of its range. The $2.86 level has been tested a few times, but sellers are still in control. On the flip side, $3.20-$3.30 is proving tough to break, so the price is stuck in between.
🔍 What the XRP Chart Is Telling Us
Looking at the daily chart, XRP price broke out from $2.40 in late June and then ran all the way to $3.66 in July. Since then, it’s been in correction mode.
Now the price is chopping sideways between $2.86 and $3.20. Candles are smaller, volume is lighter, and multiple rejections around $3.20–$3.30 show that sellers are defending that zone hard.
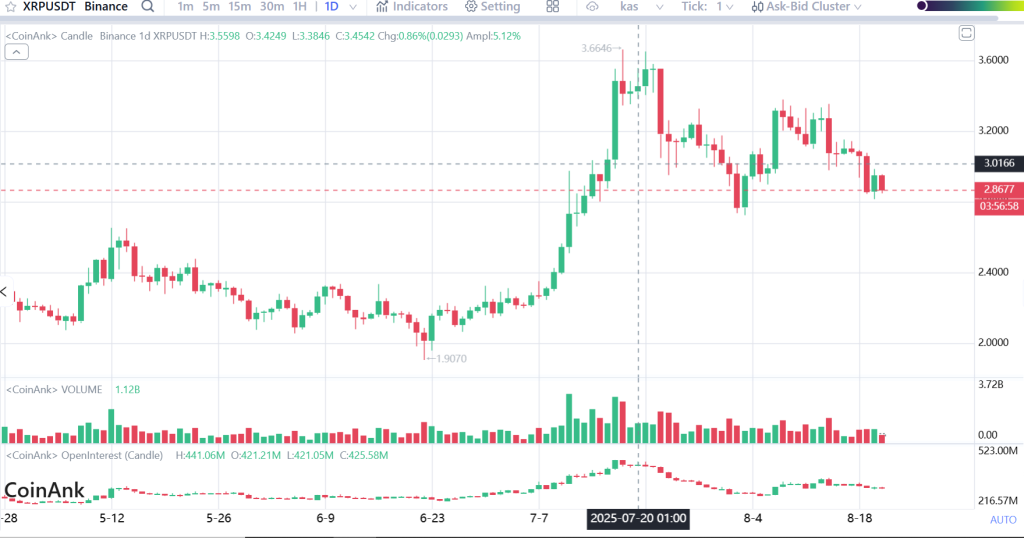
If $2.86 gives way, XRP could slide toward $2.50. But if buyers keep holding the line, we’ll likely see more sideways action.
📈 Technical Indicators (Daily Timeframe)
| Indicator | Value | Signal |
| RSI (14) | 42.169 | Weak momentum, sellers in control |
| ADX (14) | 33.031 | Strong trend, but it’s down |
| MACD (12,26) | -0.013 | Bearish crossover, pressure still on |
| CCI (14) | -151.19 | Deep in bearish territory |
| Ultimate Oscillator | 40.62 | Bears controlling across timeframes |
| Bull/Bear Power (13) | -0.250 | More selling pressure than buying |
Summary: All the signals are pointing in the same direction, bearish. Momentum is weak, the trend is strong to the downside, and sellers have the upper hand.
🔮 XRP Price Prediction Scenarios
Bullish:
If XRP price can climb above $3.18–$3.25 with volume, it could run toward $3.35 and possibly $3.55–$3.70.
Neutral:
If $2.75 holds, expect more sideways movement between $2.85 and $3.10 until something sparks a move.
Bearish:
If $2.75 breaks, XRP could head down to $2.60, with $2.45–$2.50 just below that.
🧠 Wrapping It Up
XRP price is still in a holding pattern. The $2.86 level is keeping it afloat for now, but all the indicators are flashing bearish.
Unless the bulls push back above $3.20, the most likely scenario today is more sideways action between $2.85 and $3.10. If $2.75 breaks, expect a sharper drop.
Read Also: XRP Profit-Taking Volume Is Highest in 8 Months, Data Reveals
Subscribe to our YouTube channel for daily crypto updates, market insights, and expert analysis.

