“Alibaba is up after the company releases AI model it says surpasses DeepSeek-v3.“
Alibaba with ticker BABA is trading sideways for two years, but we are tracking a larger bullish ABCDE triangle pattern in circled wave B before we will see a continuation higher for circled wave C.
With recent rebound away from the lower triangle line due to the release of AI model that surpasses DeepSeek, seems like subwave C is finished and it’s now rising within wave D which can recover the price back to the upper triangle line before we will see another and final wave E slow down to complete a triangle in circled wave B.
Basic bullish triangle shows that Alibaba can be trading in the middle of subwave D of a larger bullish ABCDE triangle pattern within higher degree wave B before a breakout higher for wave C.
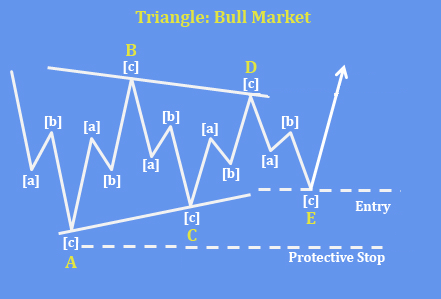
Basic bullish triangle pattern
Get Full Access To Our Premium Elliott Wave Analysis For 14 Days. Click here.
