AMZN Elliott Wave technical analysis [Video]
AMZN Elliott Wave technical analysis
Function: Trend.
Mode: Impulsive.
Structure: Motive.
Position: Wave (v) of {i}.
Direction: Upside in (v).
Details: The market appears to be completing a five-wave sequence within wave {i}, with wave (v) currently unfolding. Wave (iii) previously extended, supporting ongoing upside potential in wave (v).
AMZN Elliott Wave Technical Analysis
Function: Trend.
Mode: Impulsive.
Structure: Motive.
Position: Wave (v) of {i}.
Direction: Upside in (v).
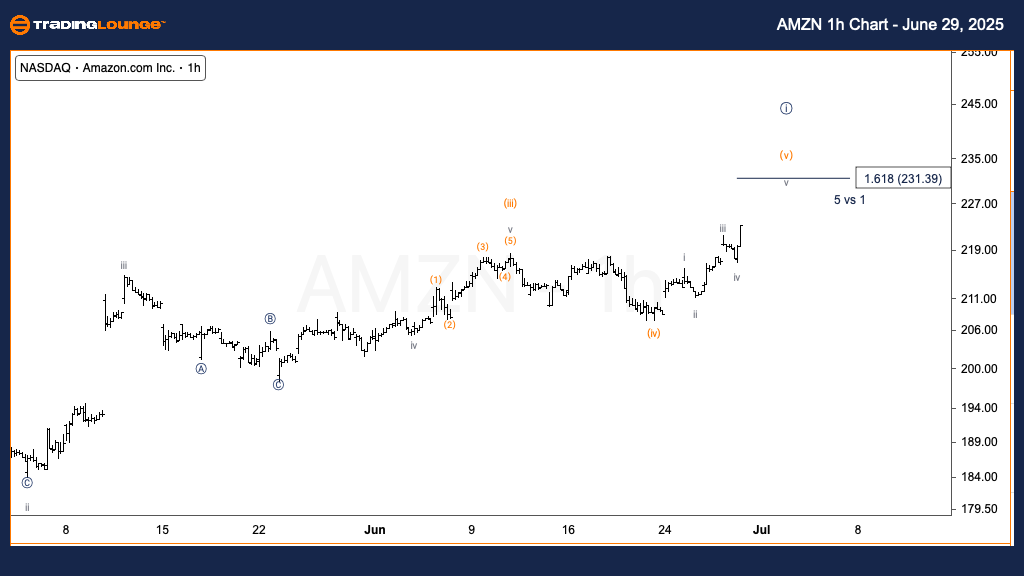
Details: With wave iii and wave i of (v) showing similar lengths, wave v could extend. This extension might drive price action toward the top of Minor Group 1, targeting $230.

This analysis for Amazon.com Inc. (AMZN) covers both daily and 1-hour charts, utilizing Elliott Wave Theory to forecast market direction.
Daily chart overview:
AMZN is progressing through wave (v) of {i}, indicating the final phase of a five-wave pattern from April’s lows. With a previously extended wave (iii), wave (v) could either reach similar length or truncate. A corrective wave {ii} might follow upon completion.
One-hour chart overview:
Wave (v) is developing with clear structure. The similarity in length between waves iii and i of (v) supports the likelihood of an extension in wave v. Price may reach the top of MinorGroup1, around $230, which aligns with Fibonacci projections in typical motive wave formations.
AMZN Elliott Wave technical analysis [Video]