Authors:
(1) SIMONE CASALE-BRUNET, École Polytechnique Fédérale de Lausanne, Switzerland;
(2) MIRKO ZICHICHI, Universidad Politécnica de Madrid, Spain;
(3) LEE HUTCHINSON, WhaleAnalytica.com, Switzerland;
(4) MARCO MATTAVELLI, École Polytechnique Fédérale de Lausanne, Switzerland;
(5) STEFANO FERRETTI, University of Urbino “Carlo Bo”, Italy.
Table of Links
1 Introduction
2 State of Art
3 Projects Selection and Data Collection
3.1 Blockchain data
3.2 Twitter data
4 Data Analysis and Results
4.1 Ethereum wallets and Twitter users and 4.2 The communities
4.3 Hashtags
4.4 The role of the social network community
5 Conclusions and References
4.1 Ethereum wallets and Twitter users
The NFT market has seen exponential growth from January 2021 to the present both in terms of volumes traded and users who have purchased at least one NFT [2]. As the first analysis, we analysed the growth that occurred on this ecosystem in terms of number of transactions and tweets, and in terms of number of unique Twitter users and Ethereum wallets who participated in the various project communities. The data reported in Table 2, and summarized in Figure 2, shows how in one year the PFP interest on Twitter went from 50 daily tweets in the beginning of January 2021 to more than 50,000 daily tweets in mid April 2022 by considering only the 18 selected projects. In the same period the number of daily unique Twitter users passed from 50 to more than 20,000 with a peak of 60,000, onboarding during the whole period more than 1 million unique active users. Interestingly, from Figure 2 (c) and (d) both the new and cumulative Twitter users and Ethereum wallets follow the same trend: this means that owning one of these NFTs implies therefore also participating in social activity on Twitter.
4.2 The communities
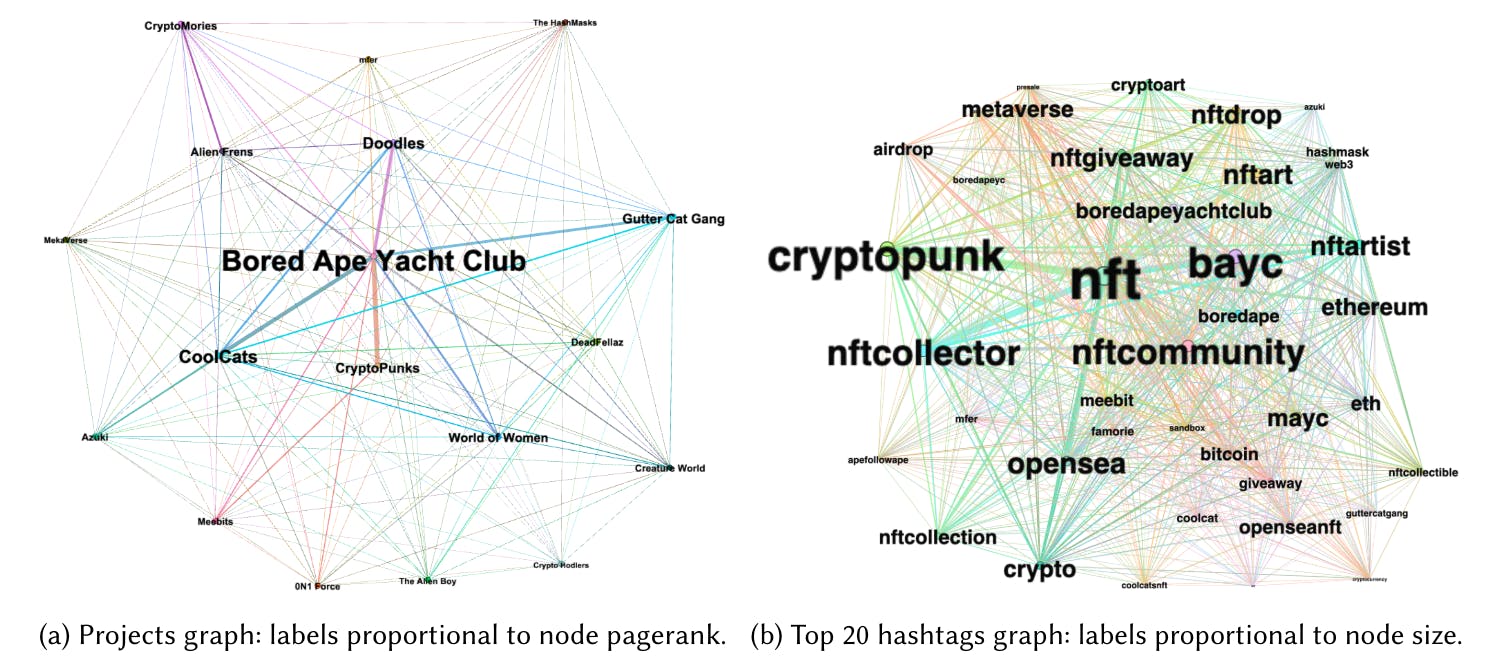
In order to identify the interactions and connections that were formed across the communities of each project, we performed as a first analysis one that aimed to identify common Twitter users and Etehereum wallets. For each collection we defined: (i) the list of Twitter users who have posted at least one tweet attributable to a collection (i.e., mentioning the official account, or using one of the hashtags defined in Table 1), (ii) the list of Ethereum wallets that have purchased at least one of the tokens in the collection. Figure 3a depicts a matrix showing for each cell (8, 9) the number of common Twitter users between the project shown in the i-row and the one shown in the j-column. The matrix can be read row by row: for each row i, the total number of users is given by the cell on the diagonal (i,i), the cells on the i-th row are then normalized to this. Similarly, it can be read column by column. The same considerations can be made when considering the Ethereum wallets that are illustrated in Figure 3b. From both of these figures we can see that the projects that dominate in terms of Twitter users and Ethereum wallets are the CryptoPunks, BAYC, Cool Cats, Gutter Cat, World of Women, and Doodles. A second type of analysis that we performed was to analyze the tweets in common between pairs of projects and represent this information as an undirected weighted graph. The graph was constructed by defining a node for each project and defining a weighted arc between projects where the weight. As the weight of each node was assigned the number of tweets and as the weight of each arc the number of common tweets


(i.e., counting the number of tweets that concern the two projects at the same time). The resulting graph is shown in Figure 4a, while the structural statistics of the graph are summarized in Table 3a. The graph consists of 18 nodes (the number of projects), and 153 arcs in a single connected component. All the nodes are connected with the remaining 17 (see average degree, transitivity and edge density): this indicates how the social community, although polarized toward a few projects, is highly connected (i.e. average clustering equal to 1). For this reason, modularity is equal to 0, i.e. having a single cluster there is no di#erence among edges within groups and edges expected on the basis of chance [11]. We successively performed a pagerank analysis to identify which nodes were the most in”uential: results are reported in Figure 5b and we can see that the most in”uential ones are BAYC, CryptoPunks, Cool Cats, Gutter Cat, World of Women, and Doodles. These are the same ones that were identi!ed in the previous analysis and, as can also be seen from Figure 6a, also the ones with the highest number of associated tweets. For each project we then tried to identify commonality with the others by going to identify the heaviest graph arcs. In other words, for each project we identi!ed the three most related by going for the ones with the most tweets in common. Table 3b summarizes these results: you can see that the BAYC are most often present and most connected with the other projects.


