ASX: BHP Group Limited – BHP Elliott Wave technical analysis
Our updated Elliott Wave analysis focuses on BHP GROUP LIMITED (ASX:BHP), showing promising upward potential. The recently completed wave 2-orange appears to have formed a Zigzag pattern, indicating a possible rise with wave 3-orange underway. This section outlines our forecasted target range and the key price levels to confirm this bullish scenario.
ASX: BHP Group Limited – BHP one-day chart (semilog scale) analysis
Wave function: Major trend (Intermediate degree, orange).
Wave mode: Motive.
Structure type: Impulse.
Wave position: Wave 3-orange.
Details:
Starting from the low at 33.25, wave 1-orange unfolded into a five-wave structure. Following that, wave 2-orange likely completed as an ABC grey Zigzag. This progression supports the idea that wave 3-orange is currently forming, targeting the 42.70–47.84 range. Maintaining a price above 35.52 keeps the bullish wave count intact.
Invalidation Point: 35.52.
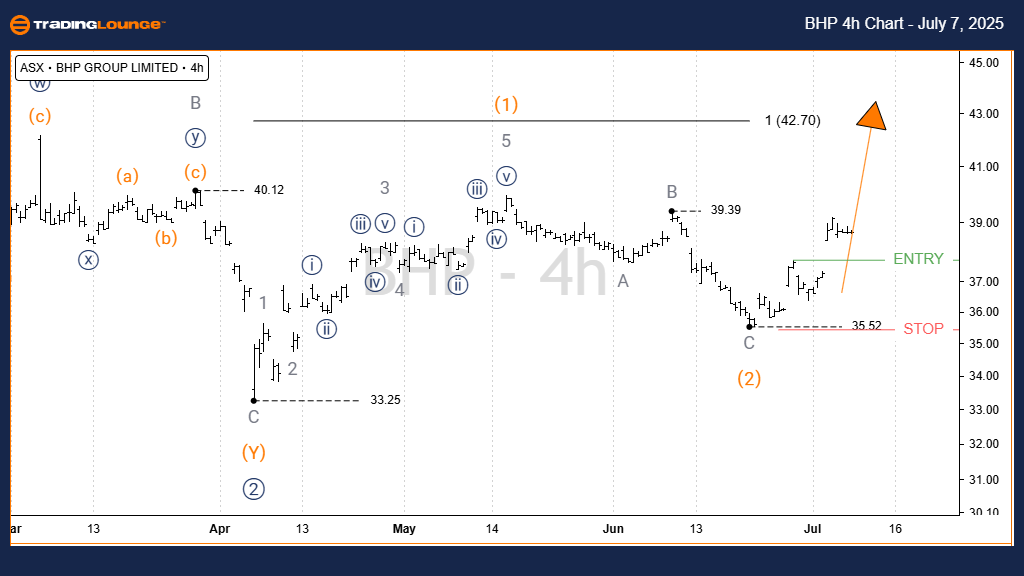
ASX: BHP Group Limited – BHP Elliott Wave technical analysis four-hour chart
Zooming into the 4-hour timeframe, the structure remains consistent with the 1D analysis. A long trade setup can be considered once the price breaks above the defined entry threshold, confirming the bullish wave development.
Wave function: Major trend (Intermediate degree, orange).
Wave mode: Motive.
Structure type: Impulse.
Wave position: Wave 3-orange.
Invalidation point: 35.52.
Conclusion
Our Elliott Wave insights for BHP GROUP LIMITED (ASX:BHP) combine both short-term patterns and longer-term trends. We’ve identified specific price levels that support or invalidate the current wave outlook. These targets aim to assist traders in aligning with objective and informed market positions.