
Bitcoin is back on traders’ radar after bouncing off a strong support level near $102,500. All eyes are now on the charts, where technical signals and past price action are hinting at a possible move up to $115,000. The price is holding steady, and things look like they’re coiling up for a potential breakout.
Top analyst CryptosBatman helped bring even more attention to this setup. On X, he pointed out the clean chart structure and reminded followers that similar patterns in the past led to solid 11%+ pumps. With the BTC price consolidating and the downtrend line already tested, many in the crypto community are keeping watch for a breakout that could mirror those previous rallies.
BTC Price Chart Shows Repeated Bullish Patterns
A closer look at the 4H BTC chart reveals a repeated pattern of price consolidation followed by double-digit gains. The previous two rallies, marked in April and May, saw gains of 12.27% and 11.12%, respectively. Each occurred after BTC had stabilized near a support level and moved through a descending trendline.
The current setup shows Bitcoin price trading slightly above $105,000, resting above a key horizontal support zone near $102,500. This level has been tested multiple times, validating it as a reliable area where buyers are stepping in. A falling wedge pattern has also formed, typically known as a bullish structure, which suggests a breakout could follow if BTC price breaches the upper boundary of the wedge.
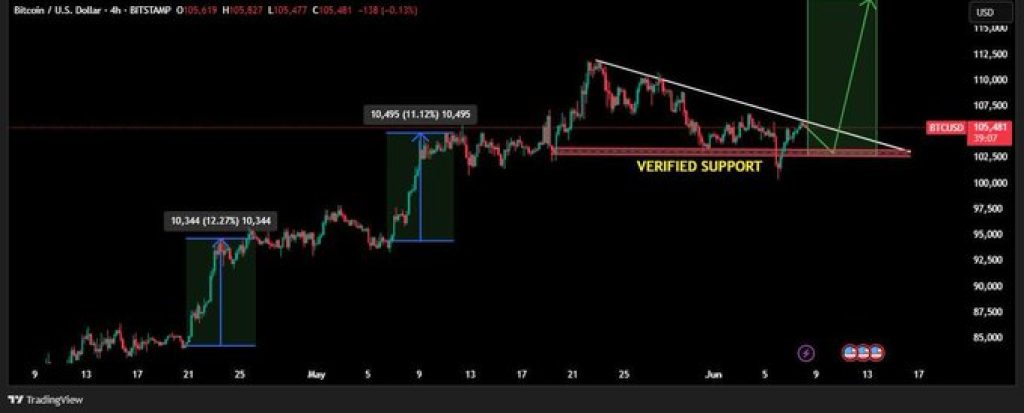
BTC Support Holds as Downtrend Line Faces Pressure
The support at $102,500 has held firm through several attempts to break lower. This horizontal level is marked on the chart as “Verified Support,” and it appears to be acting as a base for the next possible move. The resistance line formed by lower highs continues to compress price action, further signaling a potential breakout.
CryptosBatman pointed out that this setup resembles previous moments before major upside moves. He noted that the market has completed a phase of consolidation and the descending trendline has already been tested, suggesting that resistance may be weakening. These conditions have led to increased speculation about a breakout to the $115,000–$117,000 range.
Read Also: XRP Price on Edge as Ripple’s June 16 SEC Deadline Draws Near
Traders Monitor Momentum Near Breakout Zone
While current price action remains within a defined range, the compression between support and resistance often signals that a move is near. BTC Chart analysis shows a convergence of trendlines, indicating a narrowing window for volatility. If the pattern plays out in line with previous instances, the move upward could be swift and match the scale of earlier rallies.
Volume and market participation remain the key variables in confirming any breakout. Traders continue to monitor both technical setups and sentiment on social media platforms for confirmation. Until a clean move above the descending trendline takes place, BTC price remains within its consolidation structure, with the support at $102,500 acting as the key level to watch.
Follow us on X (Twitter), CoinMarketCap and Binance Square for more daily crypto updates.
Read our recent crypto market updates, news, and technical analysis here.

We recommend eToro
Active user community and social features like news feeds, chats for specific coins available for trading.
Wide range of assets: cryptocurrencies alongside other investment products such as stocks and ETFs.
Copy trading: allows users to copy the trades of leading traders, for free.
User-friendly: eToro’s web-based platform and mobile app are user-friendly and easy to navigate.