Join Our Telegram channel to stay up to date on breaking news coverage
The Bitcoin price tumbled 2% in the past 24 hours to trade at $111,230 as of 3:36 a.m. EST on trading volume that jumped 9% to $73.6 billion.
The BTC drop came as the crypto market turned sharply lower on Tuesday after Federal Reserve Chair Jerome Powell said another interest rate cut in December is far from certain.
Powell: A December rate cut is “far from” a foregone conclusion
Markets did NOT like that pic.twitter.com/EjrmJIAqLG
— Morning Brew ☕️ (@MorningBrew) October 29, 2025
Speaking after the October Federal Open Market Committee (FOMC) meeting, which cut rates by 25 basis points, Powell said the US labor market is weakening while inflation remains “somewhat elevated.”
He added that higher tariffs are adding to price pressures, which in turn creates a tricky balance for the central bank.
The Fed decided to end its balance-sheet runoff starting December 1, saying reserves have reached levels consistent with ample liquidity, signaling that quantitative tightening is coming to an end.
Powell said the step was necessary because repo rates and funding costs have been rising recently.
Bitcoin Price Holds Channel Support As Bulls Eye Recovery
The BTC price appears to be recovering after a brief correction that tested the lower boundary of the rising channel pattern around $104,000, with early signs of renewed strength.
The Bitcoin price on the 3-day chart shows it trading near $111,230, rebounding from the lower Bollinger Band at $103,965. This bounce highlights strong buying activity within the current rising channel.
BTC remains within a medium-term bullish channel, although the recent series of lower highs has introduced some short-term consolidation. The 200-day Simple Moving Average (SMA), currently at $86,981, continues to act as a long-term base, which confirms that the macro trend remains bullish.
Meanwhile, the middle Bollinger Band, around $114,219, is serving as the next level of resistance, with a breakout above it likely to reestablish upward momentum toward the upper boundary near $124,472.
The Relative Strength Index (RSI), is trading at 47.45, suggesting that the price of BTC is currently in an equilibrium, which means that the asset is neither overbought nor oversold.
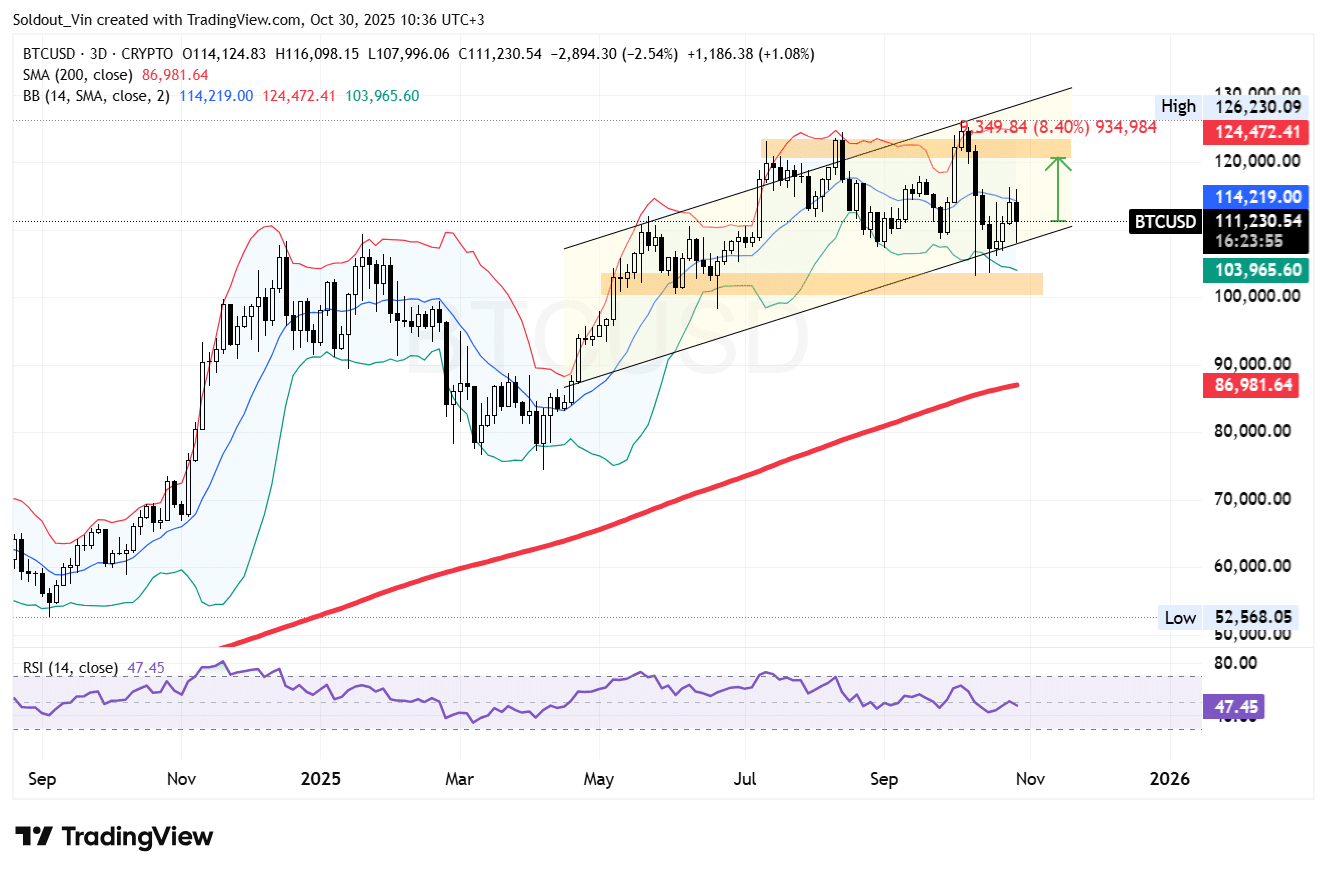
BTC Price Prediction: Bulls Target Prices Above $120K
Overall, the BTC/USD chart shows the BTC price remains constructively bullish. The Bollinger Band rebound, combined with strong support above the 200-day SMA, reflects underlying market resilience.
If bulls manage to push BTC above $114,000 and sustain the breakout, it would likely confirm the continuation of the medium-term uptrend, with potential to revisit the immediate resistance around $120,800, an 8% surge from the current level.
Sustained bullish momentum could push BTC’s price to the next resistance level at the upper Bollinger Band at $124,472.
However, a failure to maintain support above the $104,000 level could delay this recovery phase and invite deeper consolidation, with the next cushion against downward pressure at $100,470.
Related News:
Best Wallet – Diversify Your Crypto Portfolio

- Easy to Use, Feature-Driven Crypto Wallet
- Get Early Access to Upcoming Token ICOs
- Multi-Chain, Multi-Wallet, Non-Custodial
- Now On App Store, Google Play
- Stake To Earn Native Token $BEST
- 250,000+ Monthly Active Users
Join Our Telegram channel to stay up to date on breaking news coverage