XRP — the third-largest cryptocurrency by market capitalization as things stand — could be gearing up for an interesting move, one that traders watching the charts might want to pay attention to. This is not just a random guess — it’s something even Bollinger Bands, a popular yet often misinterpreted technical analysis tool, are suggesting.
For those who are not familiar with it, the concept is pretty straightforward: It was developed by John Bollinger and consists of three curves — a 20-day moving average at the core, with two deviations, one above and one below. Together, they create a range that tells you if prices are high or low.
For XRP, it’s the lower band on a daily time frame that’s recently become important. And that is where things start to get interesting. In the past, when it hits the lower band, it’s usually a sign that things might bounce back — but only if there are enough buyers to keep the price steady at that level.
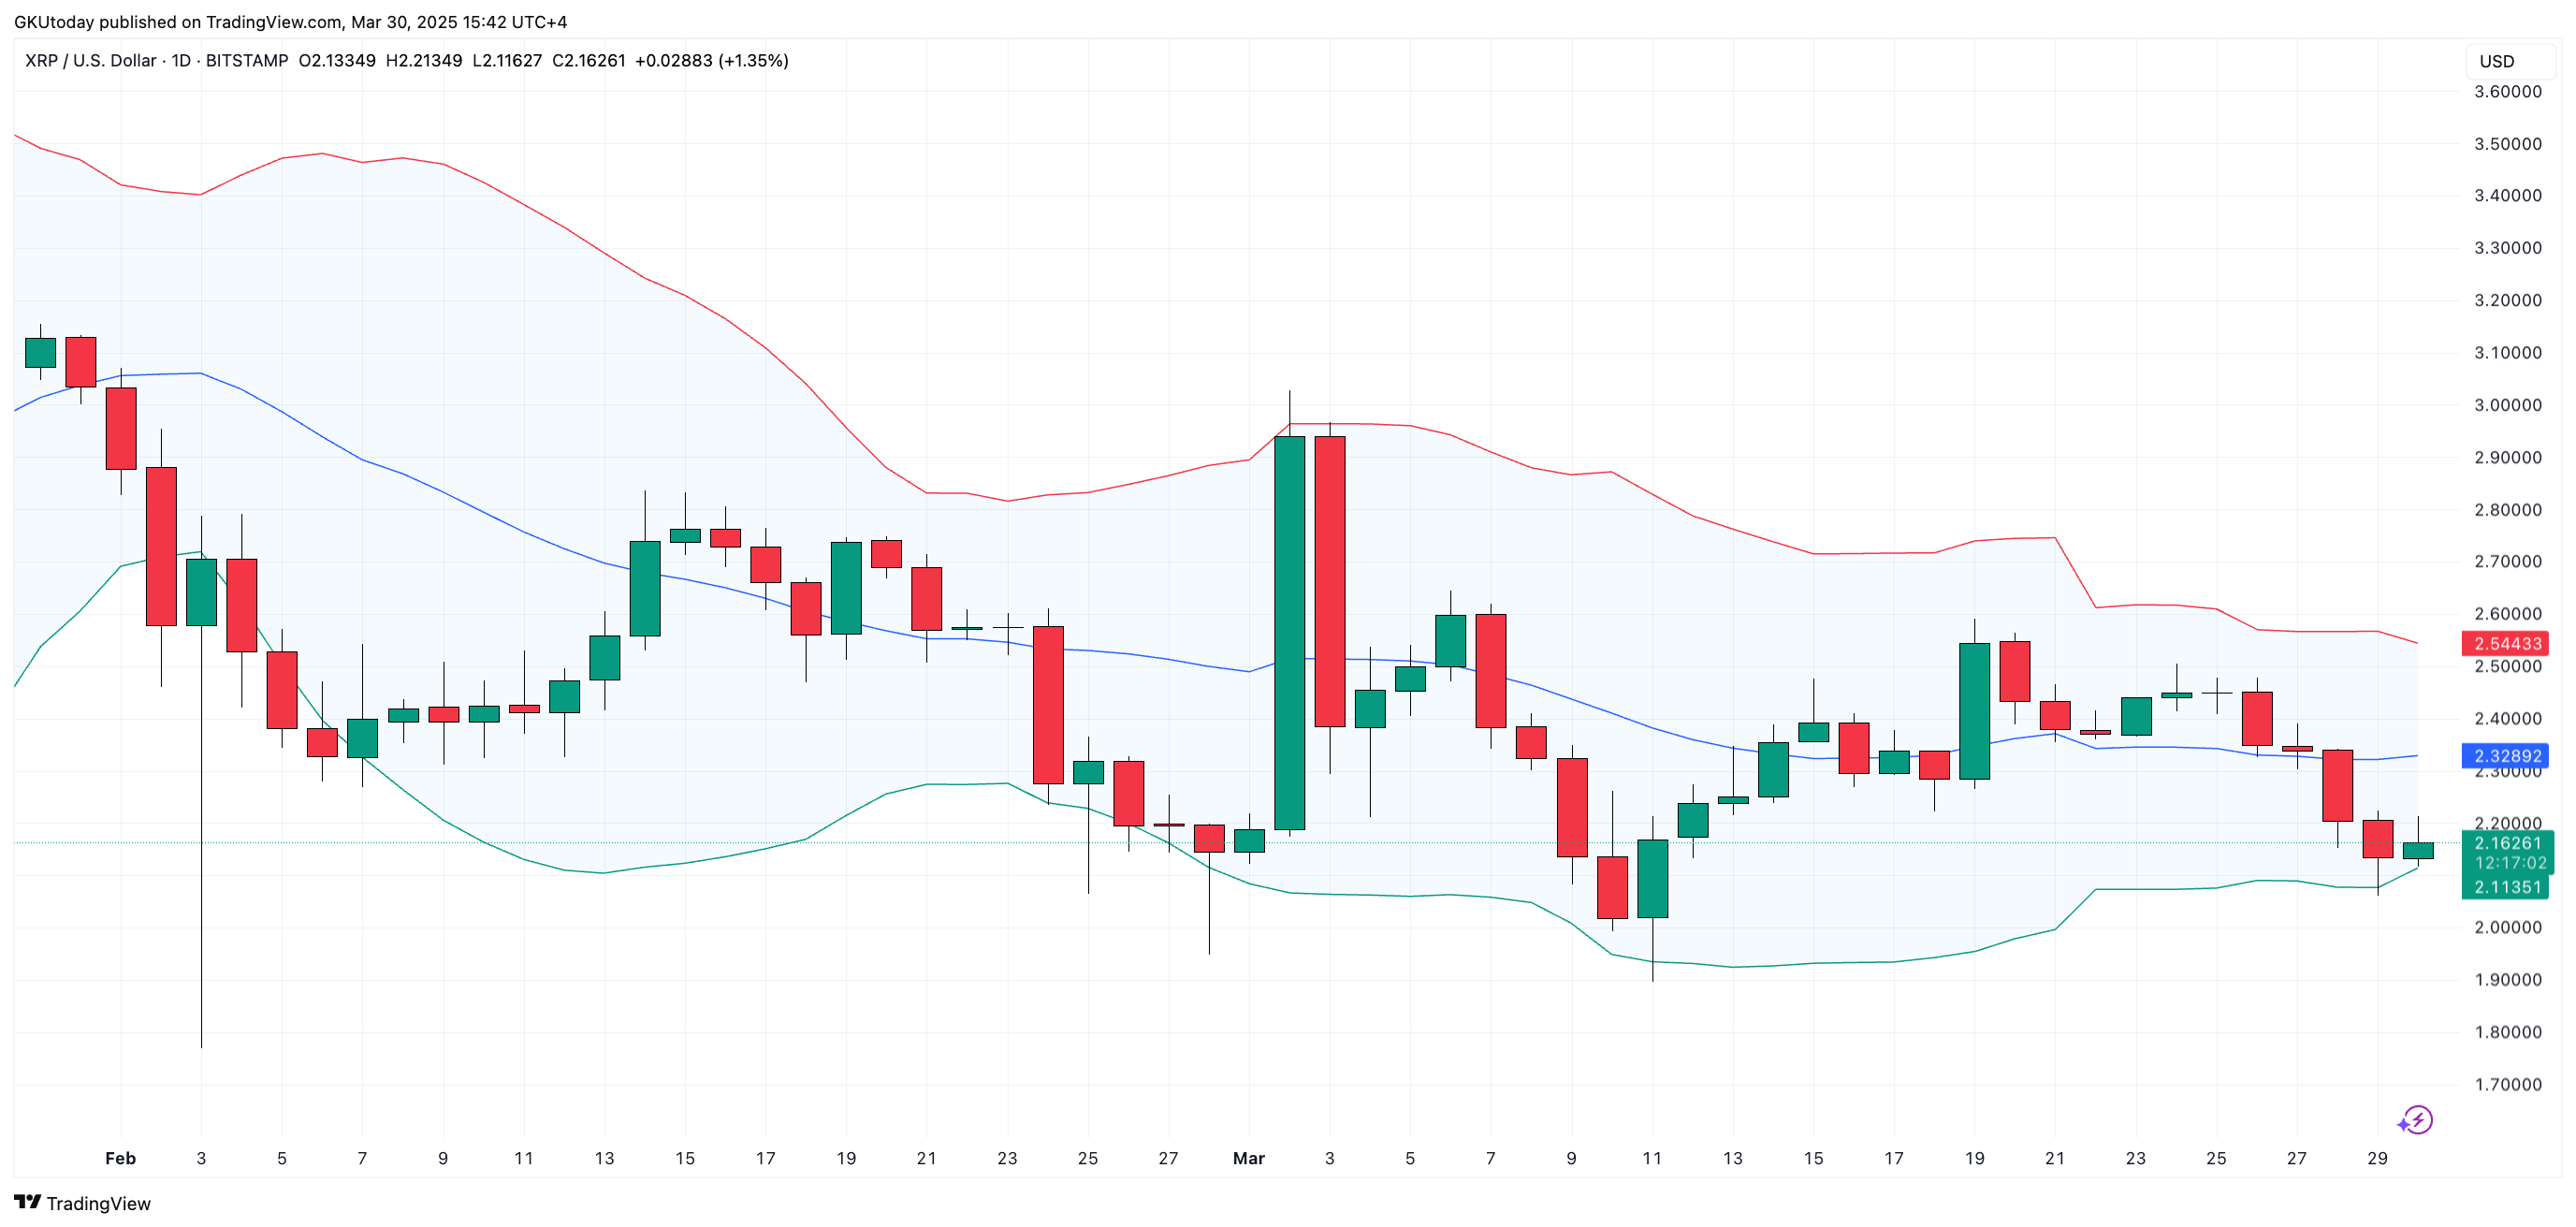
If that happens, then the next step is probably a test of the middle band, which is currently at $2.33. That’s an 8.15% climb from where XRP sits today. It’s not a huge change, but it’s definitely something to watch.
Related
And if things keep going strong, we might even see a second, more ambitious upside target: the upper band. At $2.55, it’s an 18.22% gain from where it is now.
For now, though, all eyes are on that lower band. If XRP finds its footing here, what happens next could get a whole lot more exciting.