Table of Links
Abstract and 1. Introduction
2. Data and Methodology
2.1 Bubble Timestamping
2.2 Cryptocurrency-LAND Wealth Effect
3. Results
3.1 Bubble Timestamping
3.2 Cryptocurrency-LAND Wealth Effect
3.3 Granger Causality Test
4. Conclusion and References
Appendix: Bored Ape Yacht Club’s Otherside
3.3 Granger Causality Test
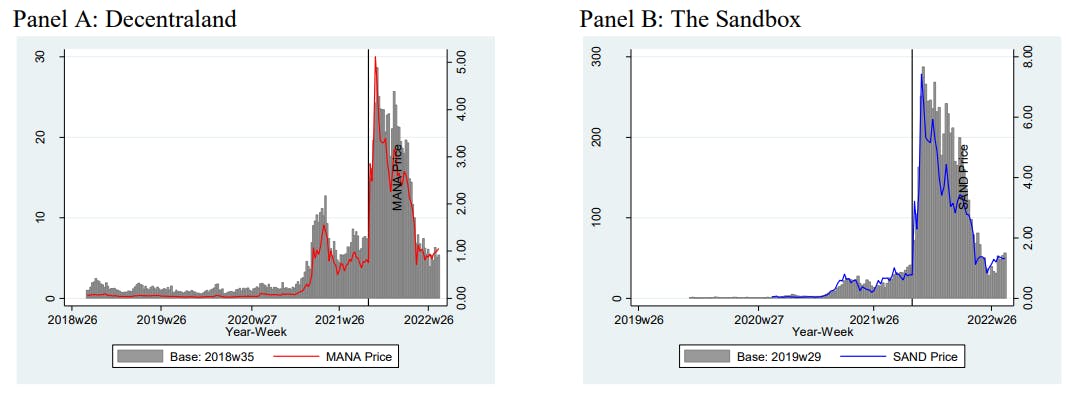
The VAR Granger causality test allows a more rigorous detection of the lead-lag relationship between cryptocurrency and LAND prices. In Panel A of Table 4, we report the summary statistics of the first-differenced, weekly data. The ADF test statistics confirm the stationarity. The pairwise correlations of the first-differenced series are lower compared to level series, but the cryptocurrency prices are still highly correlated to LAND prices (0.4693 for Decentraland and 0.4172 for The Sandbox). LAND prices are also correlated to BTC and ETH, but to lesser extent.
Panel C and D show the Granger causality test for Decentraland and The Sandbox for up to 3 lags. In the extended VAR, we also include both BTC and ETH prices to control for market movements. In all lags and specifications, cryptocurrency prices lead LAND prices, where pvalues for the cryptocurrency-to-LAND direction are below 1 percent level for most specifications, while the p-values for the reverse direction always exceed 10 percent, providing support for our wealth effect interpretation. Our result is similar to Goetzmann, Renneboog and Spaenjers (2011), who find that equity market returns have a strong, positive relationship with art market index between 1840 and 2007, and complements Dowling (2022b) with the direct investigation of comovement between LAND NFTs and their corresponding cryptocurrencies.
Table 4: Granger Causality Test and the Wealth Effect
This table reports the various results leading to VAR Granger causality test. Panel A reports the summary statistics of the first-differenced, weekly time series along with the statistics of the augmented Dickey and Fuller (1979) test of unit root. Panel B reports the pairwise correlation of the first-differenced data. Panel C and D report the F-test statistic of the test that lagged value of cryptocurrencies Granger causes LAND prices at up to 3 lags for Decentraland and The Sandbox respectively. In the extended version, the time series of Bitcoin and Ether prices are also included.


Our result complements Nakavachara and Saengchote (2022), who find that transactions settled in SAND whose price increased more than other cryptocurrencies’ are priced higher in USD. The authors interpret this as the effect of unit of account, but it could also be viewed as crypto wealth effect. Their analysis ended in January 2022, when the crypto market started declining from its peak in November 2021 before suffering a collapse in mid-May, so our extended sample until August 2022 offers a more complete view of the cycle. In the Appendix, we also investigate the relationship for the Otherside metaverse of Bored Ape Yacht Club (BAYC), the iconic NFT project and one of the three NFTs analyzed by Dowling (2022b). The project launched during the downward part of the cycle and exhibit the same lead-lag relationship, so the wealth effect works in both directions.
Author:
(1) Kanis Saengchote, Chulalongkorn Business School, Chulalongkorn University, Phayathai Road, Pathumwan, Bangkok 10330, Thailand. (email: [email protected]).