DAI Stays at $1 Even When ETH Goes Crazy. Here’s the Data.
:::info
Authors:
(1) Zhenbang Feng, Department of Electrical and Computer Engineering, Viterbi School of Engineering, University of Southern, California Los Angeles, CA, USA (jasonfen@usc.edu);
(2) Hardhik Mohanty, Department of Electrical and Computer Engineering, Viterbi School of Engineering, University of Southern, California Los Angeles, CA, USA (hmohanty@usc.edu);
(3) Bhaskar Krishnamachari, Department of Electrical and Computer Engineering, Viterbi School of Engineering, University of Southern, California Los Angeles, CA, USA (bkrishna@usc.edu).
:::
:::tip
Editor’s note: This article is part of a broader study. You’re reading part 4 of 5. Read the rest below.
:::
Table of Links
- Abstract and I. Introduction
- II. The Mechanism
- III. Price-Stabilizing Mechanisms, IV. Simulating DAI & V. Simplified Mathematical Model for DAI
- VI. How Collateral Price Impacts Derivative Price
- VII. Risk Factors for Stable Derivatives & VIII. Conclusions and References
VI. HOW COLLATERAL PRICE IMPACTS DERIVATIVE PRICE
A. Empirical evidence
\
\
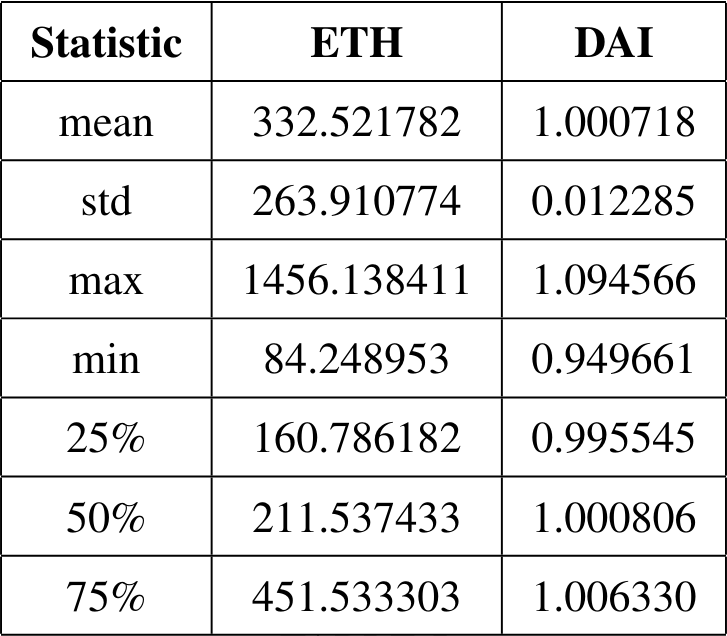
Figure-2 demonstrates the closing prices of both ETH and DAI over the two-year period from 2018 to 2020. Ethereum (ETH) exhibited significant volatility, with its price ranging from approximately $84 to $1456. The average closing price for ETH during this period was about $332.52. On the other hand, DAI demonstrated its characteristic stability. As a stablecoin, its price hovered around the $1 peg, with minor fluctuations. The average closing price for DAI was approximately $1.0007. To further understand the relationship between ETH and DAI, we calculated the correlation coefficient between their closing prices, which came out as 0.1336. The calculated correlation coefficient of 0.1336 suggests a weak positive linear relationship between the closing prices of ETH and DAI. The correlation coefficient being close to 0 is weak enough to draw any meaningful conclusions.
\
\
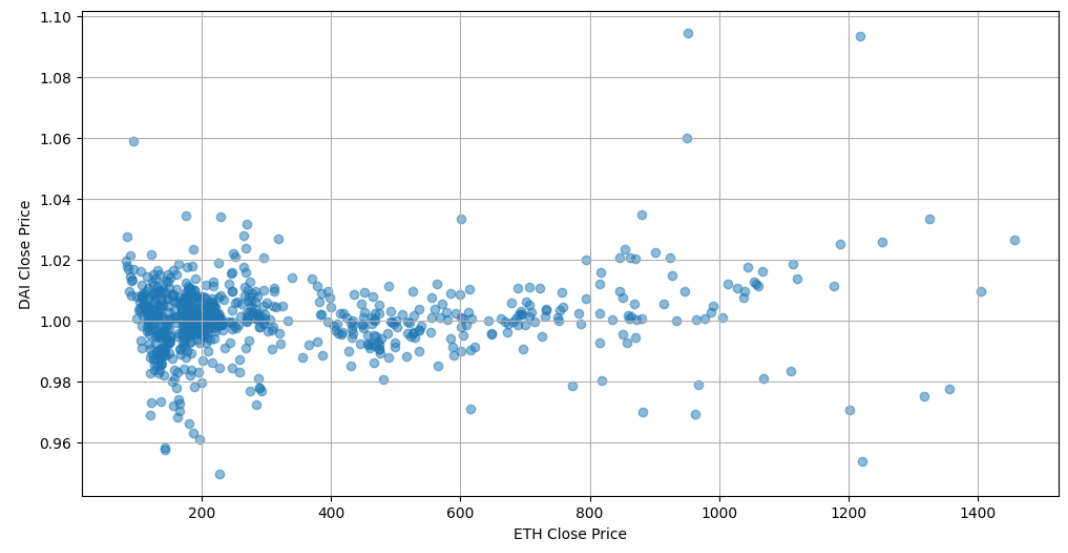
Figure-3 illustrates the scatter plot of DAI vs ETH closing prices. We observe there’s a high density of points around the DAI price of $1, confirming its stable nature. This dense cluster is spread across various ETH prices, which is consistent with the observation that DAI maintains its peg to around $1 regardless of ETH’s price movements. The scatter plot reaffirms the distinct characteristics of the two assets. DAI, being a stablecoin, predominantly hovers around the $1 mark, irrespective of the volatility and price changes exhibited by ETH. This scatter plot also aligns with the previously computed weak correlation coefficient, indicating that the movements in DAI prices have a weak linear relationship with ETH’s price movements.
B. Simulation results
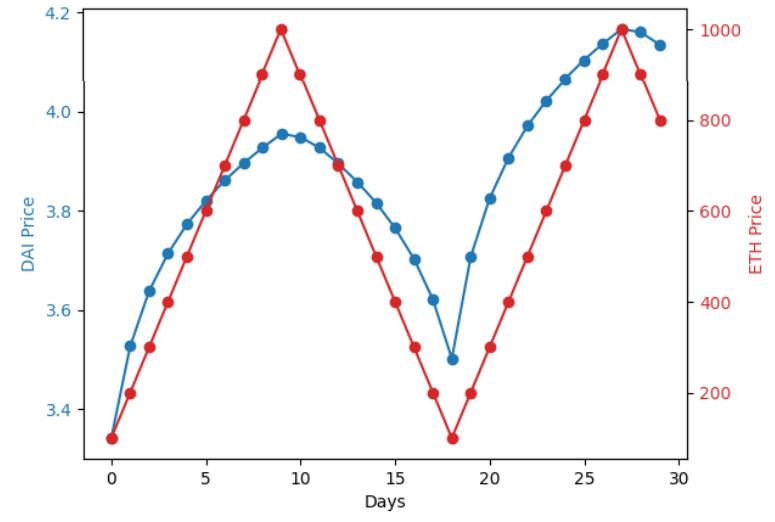
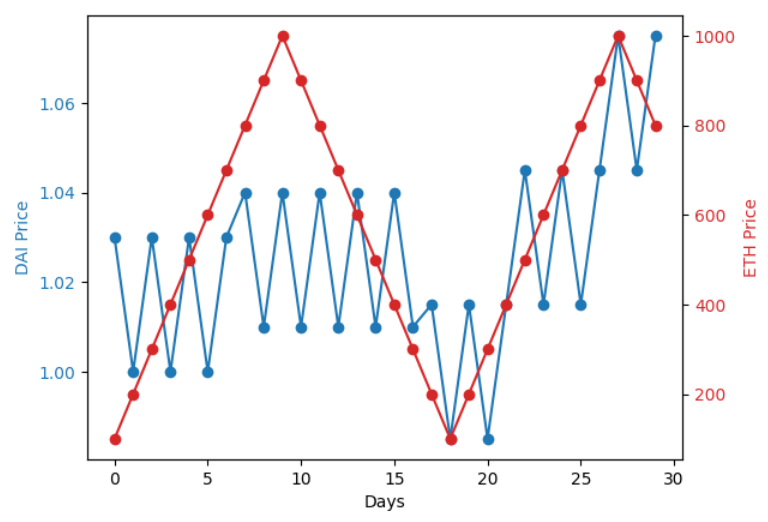
Figures-4 & 6 demonstrates the predicted value of the price of DAI through simulation models. The DAISIM simulation model initially outputs DAI prices ranging from approximately $3.34 to $4.17. This shows that the predicted DAI price significantly deviates from its pegged value of $1. This variation is attributed to the model’s lack of consideration for market beliefs and narratives. However, with the integration of a belief parameter based on the hypothesis of DAI’s peg to $1, there is a substantial improvement in price stability. The modified model generates DAI prices that fluctuate closely around the $1 mark with minimal deviations.
\
\
\
\
\
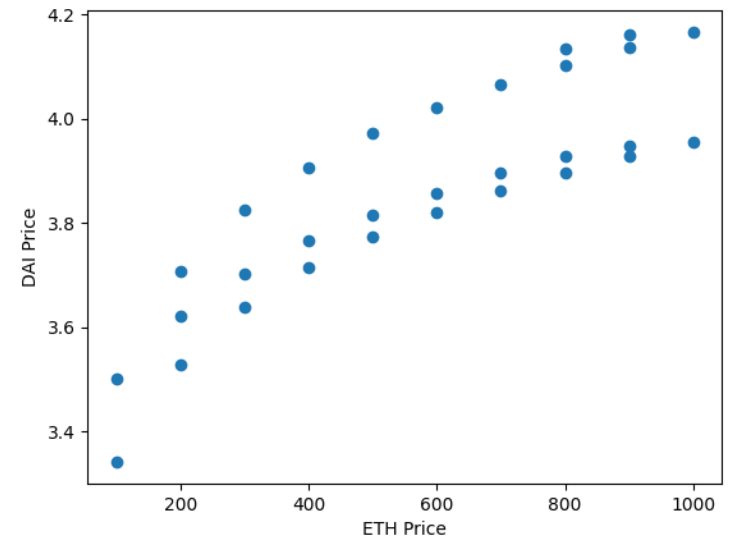
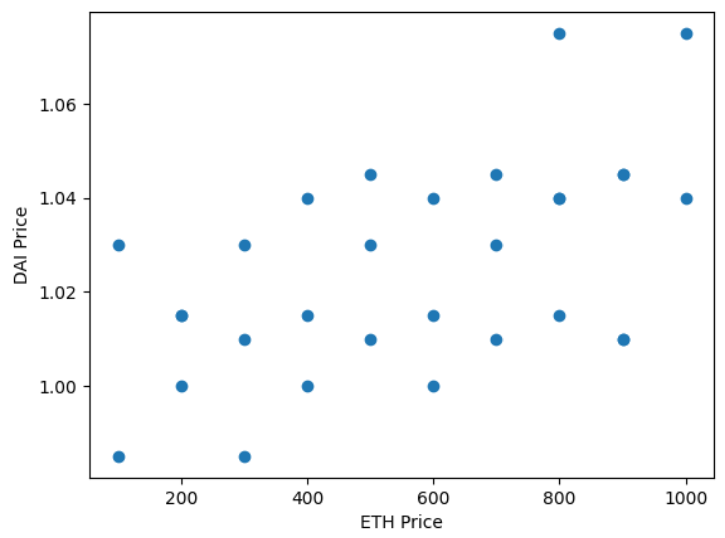
This improvement is also evidenced by examining the correlation coefficients between DAI and ETH prices in both models as depicted in Figures-5 & 7. Initially, the correlation coefficient stands at 0.86, indicating a strong positive correlation. This suggests that DAI prices are significantly influenced by ETH’s price movements, contrary to the observed behavior of DAI in the real world. However, after the introduction of the belief parameter, the correlation coefficient decreases to 0.54. The lower correlation more accurately mirrors the real-world expectation that DAI’s price remains largely independent of ETH’s market fluctuations. This observation reinforces the significance of integrating realistic market factors into financial simulation models.
\
:::info
This paper is available on arxiv under CC BY 4.0 DEED license.
:::
\