Table of Links
Abstract and I. Introduction
II. Threat Model & Background
III. Webcam Peeking through Glasses
IV. Reflection Recognizability & Factors
V. Cyberspace Textual Target Susceptibility
VI. Website Recognition
VII. Discussion
VIII. Related Work
IX. Conclusion, Acknowledgment, and References
APPENDIX A: Equipment Information
APPENDIX B: Viewing Angle Model
APPENDIX C: Video Conferencing Platform Behaviors
APPENDIX D: Distortion Analysis
APPENDIX E: Web Textual Targets
APPENDIX D DISTORTION ANALYSIS


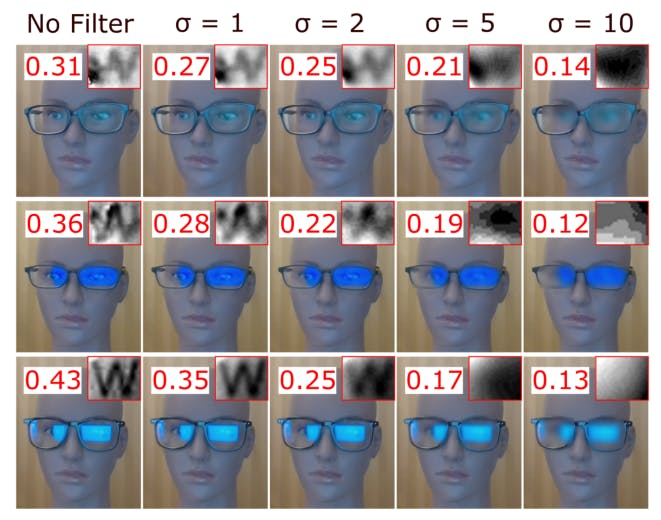
Different from previous works [25], [26], motion blur and out-of-focus blurs that are theoretically uniform within a single frame is not the number one limiting factors in the webcam peeking threat model because of the relatively shorter exposure time and closer, more constant camera-object distance. Instead, distortions with intra-frame and inter-frame variance dominate which suggests the image quality cannot be easily improved with PSF deconvolution as in [25] and new image enhancing techniques are needed.


APPENDIX E WEB TEXTUAL TARGETS
Web Text Design Conventions. Despite the fact that the default CSS font sizes are decided by web browser vendors separately, we find many of them follow the W3C recommendation [14], where H1, H2, H3 headers’ font sizes are 2, 1.5, 1.17 em respectively. To briefly explain, a text size of x em means the size is x times the current body font size of the web page [20] which is usually the same as the font size of paragraph (P) elements. Nevertheless, we note that web design standards are lacking, and designers have a large degree of freedom of choosing their own text designs. Sometimes bigger fonts are preferred in order to make the websites more


stylish and eye-catching. In this section, we thus investigate both conventional and more stylish web text sizes.
Text Sizes. We summarize the text sizes investigated in Table III where the cap height values are measured with the Acer laptop and default OS and browser settings.
G1 and G2: The first group represents the median HTML P, H1, H2, H3 texts of the 1000 websites. [48] reports that the median size of the P elements is about 12 pt and H1, H2, H3 sizes are close to the 2, 1.5, 1.17 em ratios recommended [14]. We thus use these point sizes for 1 and specify the corresponding cap heights in Table III. The second group represents the largest HTML P, H1, H2, H3 texts of the 1000 websites in [48] with the same recommended em ratios for the headers. [48] finds that about 4% of the 1000 websites use a P size as large as 21 pt. This results in H1, H2, H3 sizes of 25, 32, and 45 pt respectively.
G3: The third group represents the 117 big-font websites’ texts. We manually inspected all the 427 websites archived on SiteInspire [10]. The reason for manual analysis rather than scraping is that many large-font texts on the websites are embedded in the form of images instead of HTML text elements in order to create more flexible font styles. We then selected 117 of them based on the following criteria: (1) The webpage is still active. (2) The largest static texts that enable an adversary to identify the website through google search have a cap height of at least 10 mm when displayed on the Acer laptop. We show the different quantiles of the largest physical cap heights on the 117 websites and the converted point sizes in Table III. We find that most websites in G3 are related to art, design, and cinema industry which like to present their stylish design skills but unfortunately make the web peeking attack easier. About 1/3 of the websites are designers’ or studios’ websites that computer science/security researchers may overlook. Furthermore, 72 out of the 117 websites are ranked on Alexa from 38 to 8,851,402 with 5 websites among the top 10,000.


Authors:
(1) Yan Long, Electrical Engineering and Computer Science, University of Michigan, Ann Arbor, USA ([email protected]);
(2) Chen Yan, College of Electrical Engineering, Zhejiang University, Hangzhou, China ([email protected]);
(3) Shilin Xiao, College of Electrical Engineering, Zhejiang University, Hangzhou, China ([email protected]);
(4) Shivan Prasad, Electrical Engineering and Computer Science, University of Michigan, Ann Arbor, USA ([email protected]);
(5) Wenyuan Xu, College of Electrical Engineering, Zhejiang University, Hangzhou, China ([email protected]);
(6) Kevin Fu, Electrical Engineering and Computer Science, University of Michigan, Ann Arbor, USA ([email protected]).
This paper is