Ethena (ENA) Price Just Flashed the Same Signal as Before Its 2024 Surge – Here’s Where It Could Go Next

Ethena price is starting to catch some eyes again as traders notice a familiar pattern showing up on the 3-day chart. Back in late 2024, ENA made a big move after forming a rounded bottom, and now, it looks like that setup might be repeating.
Top analyst BATMAN shared on X that ENA could be heading into a brief correction before making another push higher. He pointed out that if the price dips down toward the lower yellow zone near $0.60, it might be a solid place to watch for a bounce.
That same level acted as a launchpad in 2024 before ENA price took off into a multi-month rally.
Looking at the chart, there’s a clear double-bottom structure with two curved lows, one around mid-2024 and another forming in mid-2025.
Both are followed by breakouts through horizontal resistance. The “We are here” label on the chart marks today’s candle, lining up almost exactly with where the last big run began.
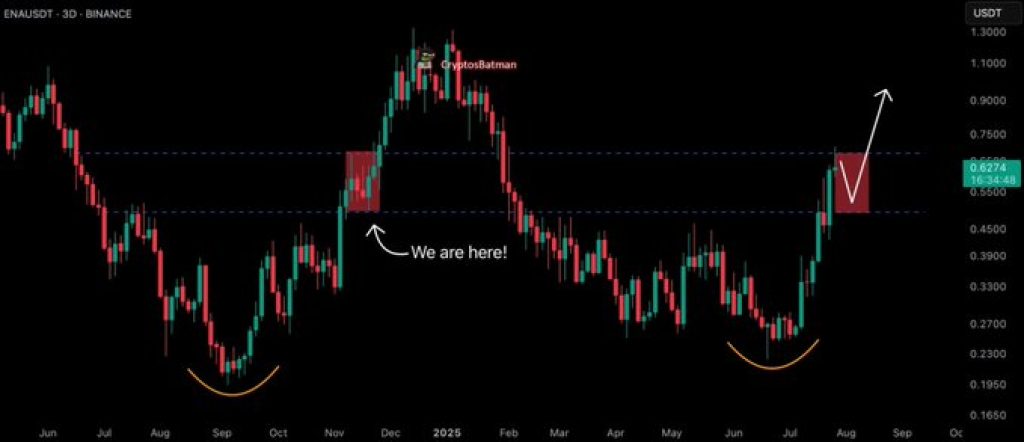
The lower yellow line around $0.60 has now flipped from resistance to support, and the upper blue line near $0.77–$0.80 is the next big zone to watch.
Right between them is a red zone, showing where a short pullback could happen before the Ethena price gears up for its next leg higher.
Analyst Sees Potential Buy Zone on Pullback For Ethena
In his tweet, BATMAN notes that ENA “is moving a lot like it did in late 2024.” He adds that the asset is “in the correction phase before the final leg up.”
His focus is on the $0.60 level as a potential reentry area. The chart supports this with a clear cup-like structure, suggesting bullish continuation.
If the pattern holds, ENA price may revisit the lower blue zone before heading toward the $0.90–$1.10 range, where the previous peak occurred. The setup remains intact as long as the price does not break below the established support.
Read Also: PI Coin Short-Term Price Outlook
Market Watching for Repetition of 2024 Breakout
Sentiment remains cautiously bullish. The setup has not confirmed a breakout yet, but the ENA chart shows no sign of invalidation.
Historical comparison, structure, and analyst input all suggest traders are watching closely for a repeat of last year’s rally.
Should Ethena price revisit the support zone and bounce with volume, it could confirm the next move. Until then, the lower range remains key for both buyers and market observers.
Subscribe to our YouTube channel for daily crypto updates, market insights, and expert analysis.

