
Ethereum price sits at $3,677, up about 16.5% this week. It keeps stepping over $3,800, only to get shoved back down.
With a big unstaking queue hanging in the background and momentum cooling a bit, the obvious question is whether this door finally swings open or shuts again. Two key metrics can help understand what happens from here.
Exchange Supply Ratio Near Lows
The Exchange Supply Ratio (ESR) is around 0.145, close to this year’s low of 0.142. A ratio is used instead of raw exchange balances because it measures exchange holdings against total circulating ETH, which changes with staking, burns, and unlocks.
For token TA and market updates: Want more token insights like this? Sign up for Editor Harsh Notariya’s Daily Crypto Newsletter here.
A low ESR means only a small chunk of supply sits on exchanges and is ready to sell. That is the setup right now.
According to the chart, local ESR highs often came before Ethereum price pullbacks. Therefore, low ESR levels exude confidence.
If ESR goes up while price slips, it usually means unstakers or large holders are moving coins to exchanges, and a dip can follow.
Funding and Open Interest
Open interest is about $55.9 billion, so a lot of futures positions are open. The funding rate is near 0.01%, still positive but lower than recent spikes (anything above 0.02% might be worrisome as that would mean high Long leverage).
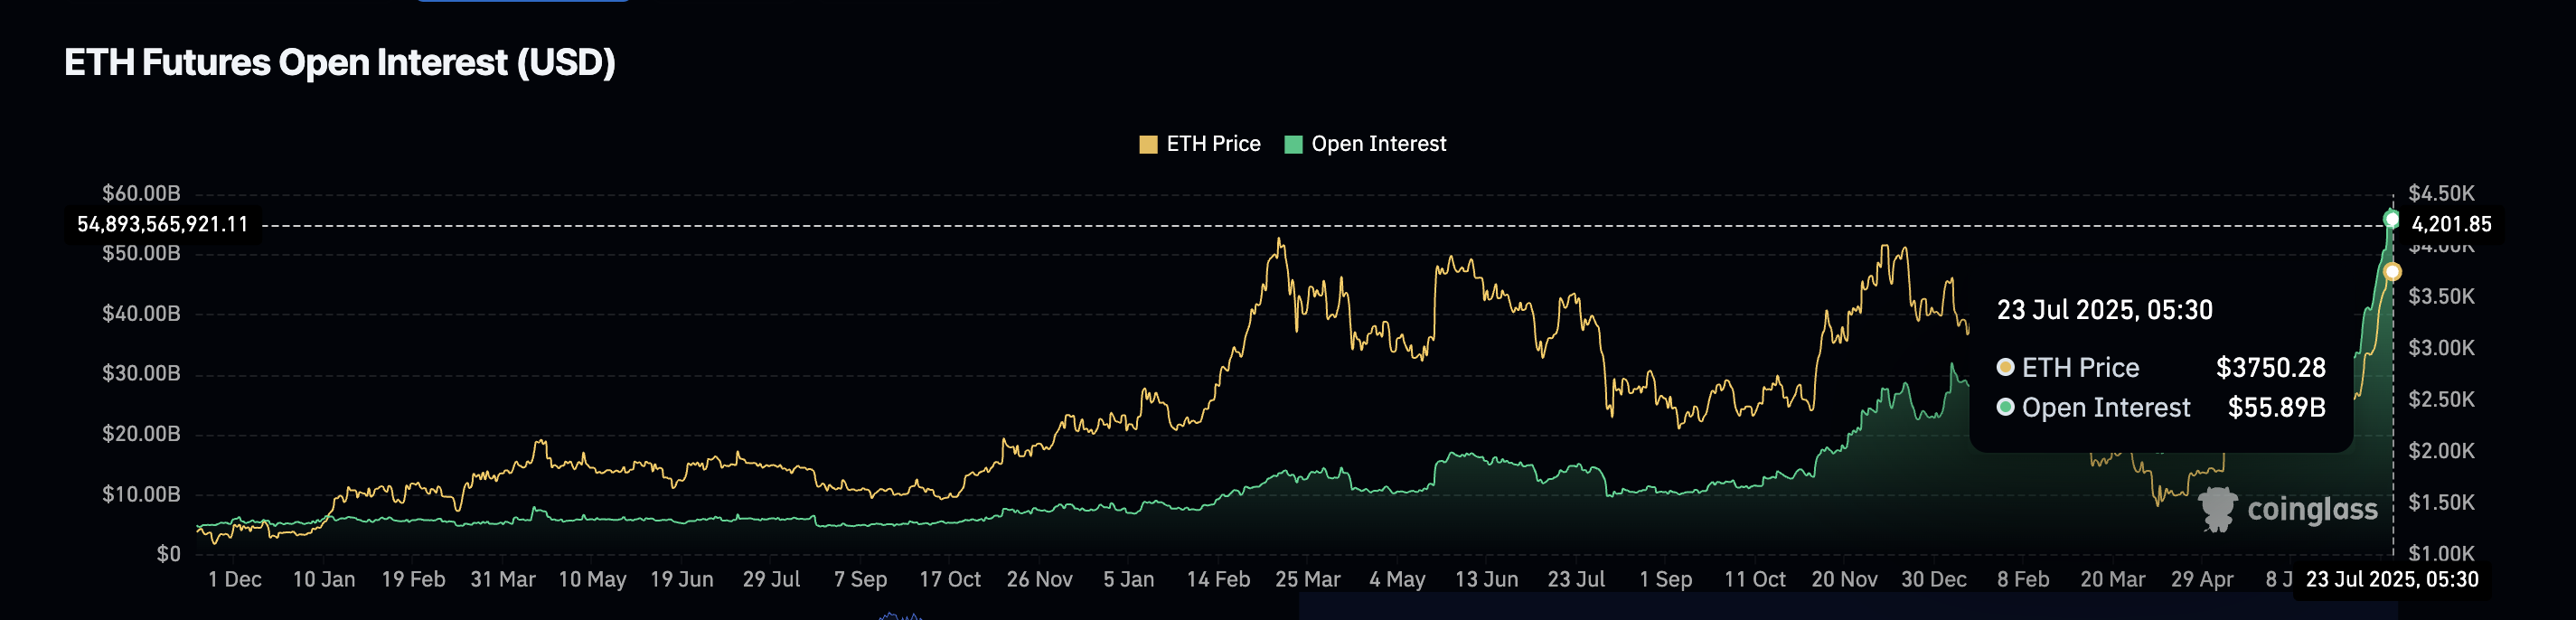
The current market structure means that traders lean long (expect prices to go higher), yet they are not paying a heavy premium to stay there. That says leverage is present without being extreme. This is a healthy scenario, and the ETH price rally looks spot-driven.
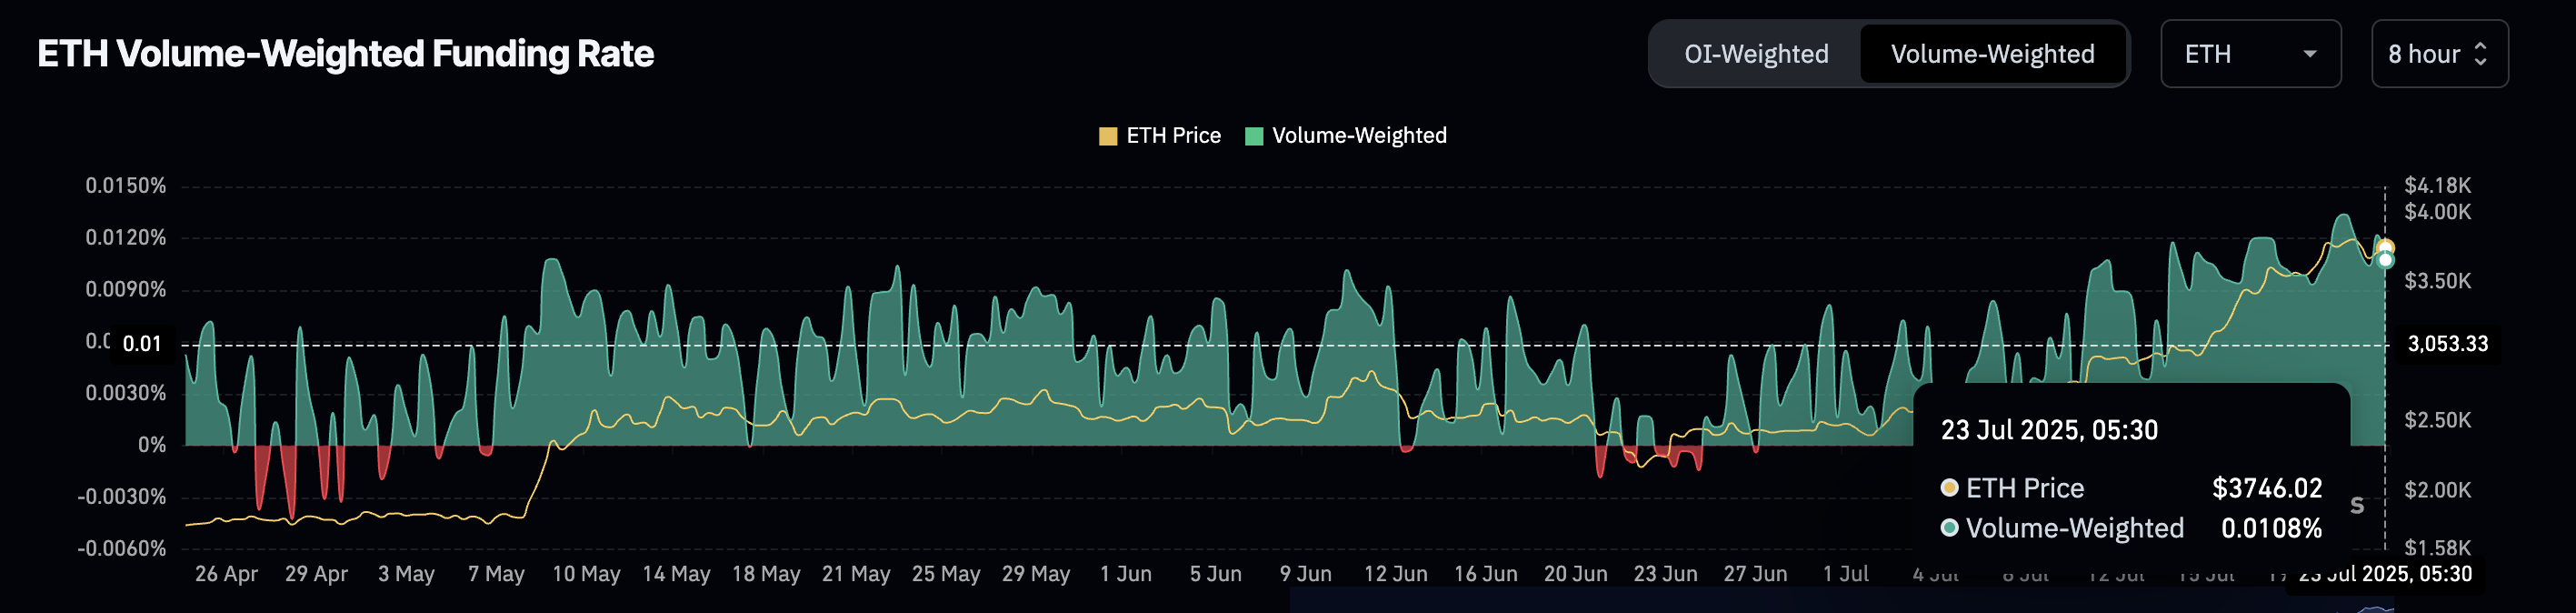
Funding is the fee that longs and shorts pay each other to keep perpetual prices near spot. Open interest is the total value of all open contracts.
Ethereum (ETH) Price Needs To Beat Key Levels
ETH is trading inside two key ranges of $3,832 and $3,635 (the 0.786 Fib level). As the upper level (resistance) would suggest, the real block sits just above the “$3,800 door.” Yet simply breaching the $3,832 resistance like earlier might not help.
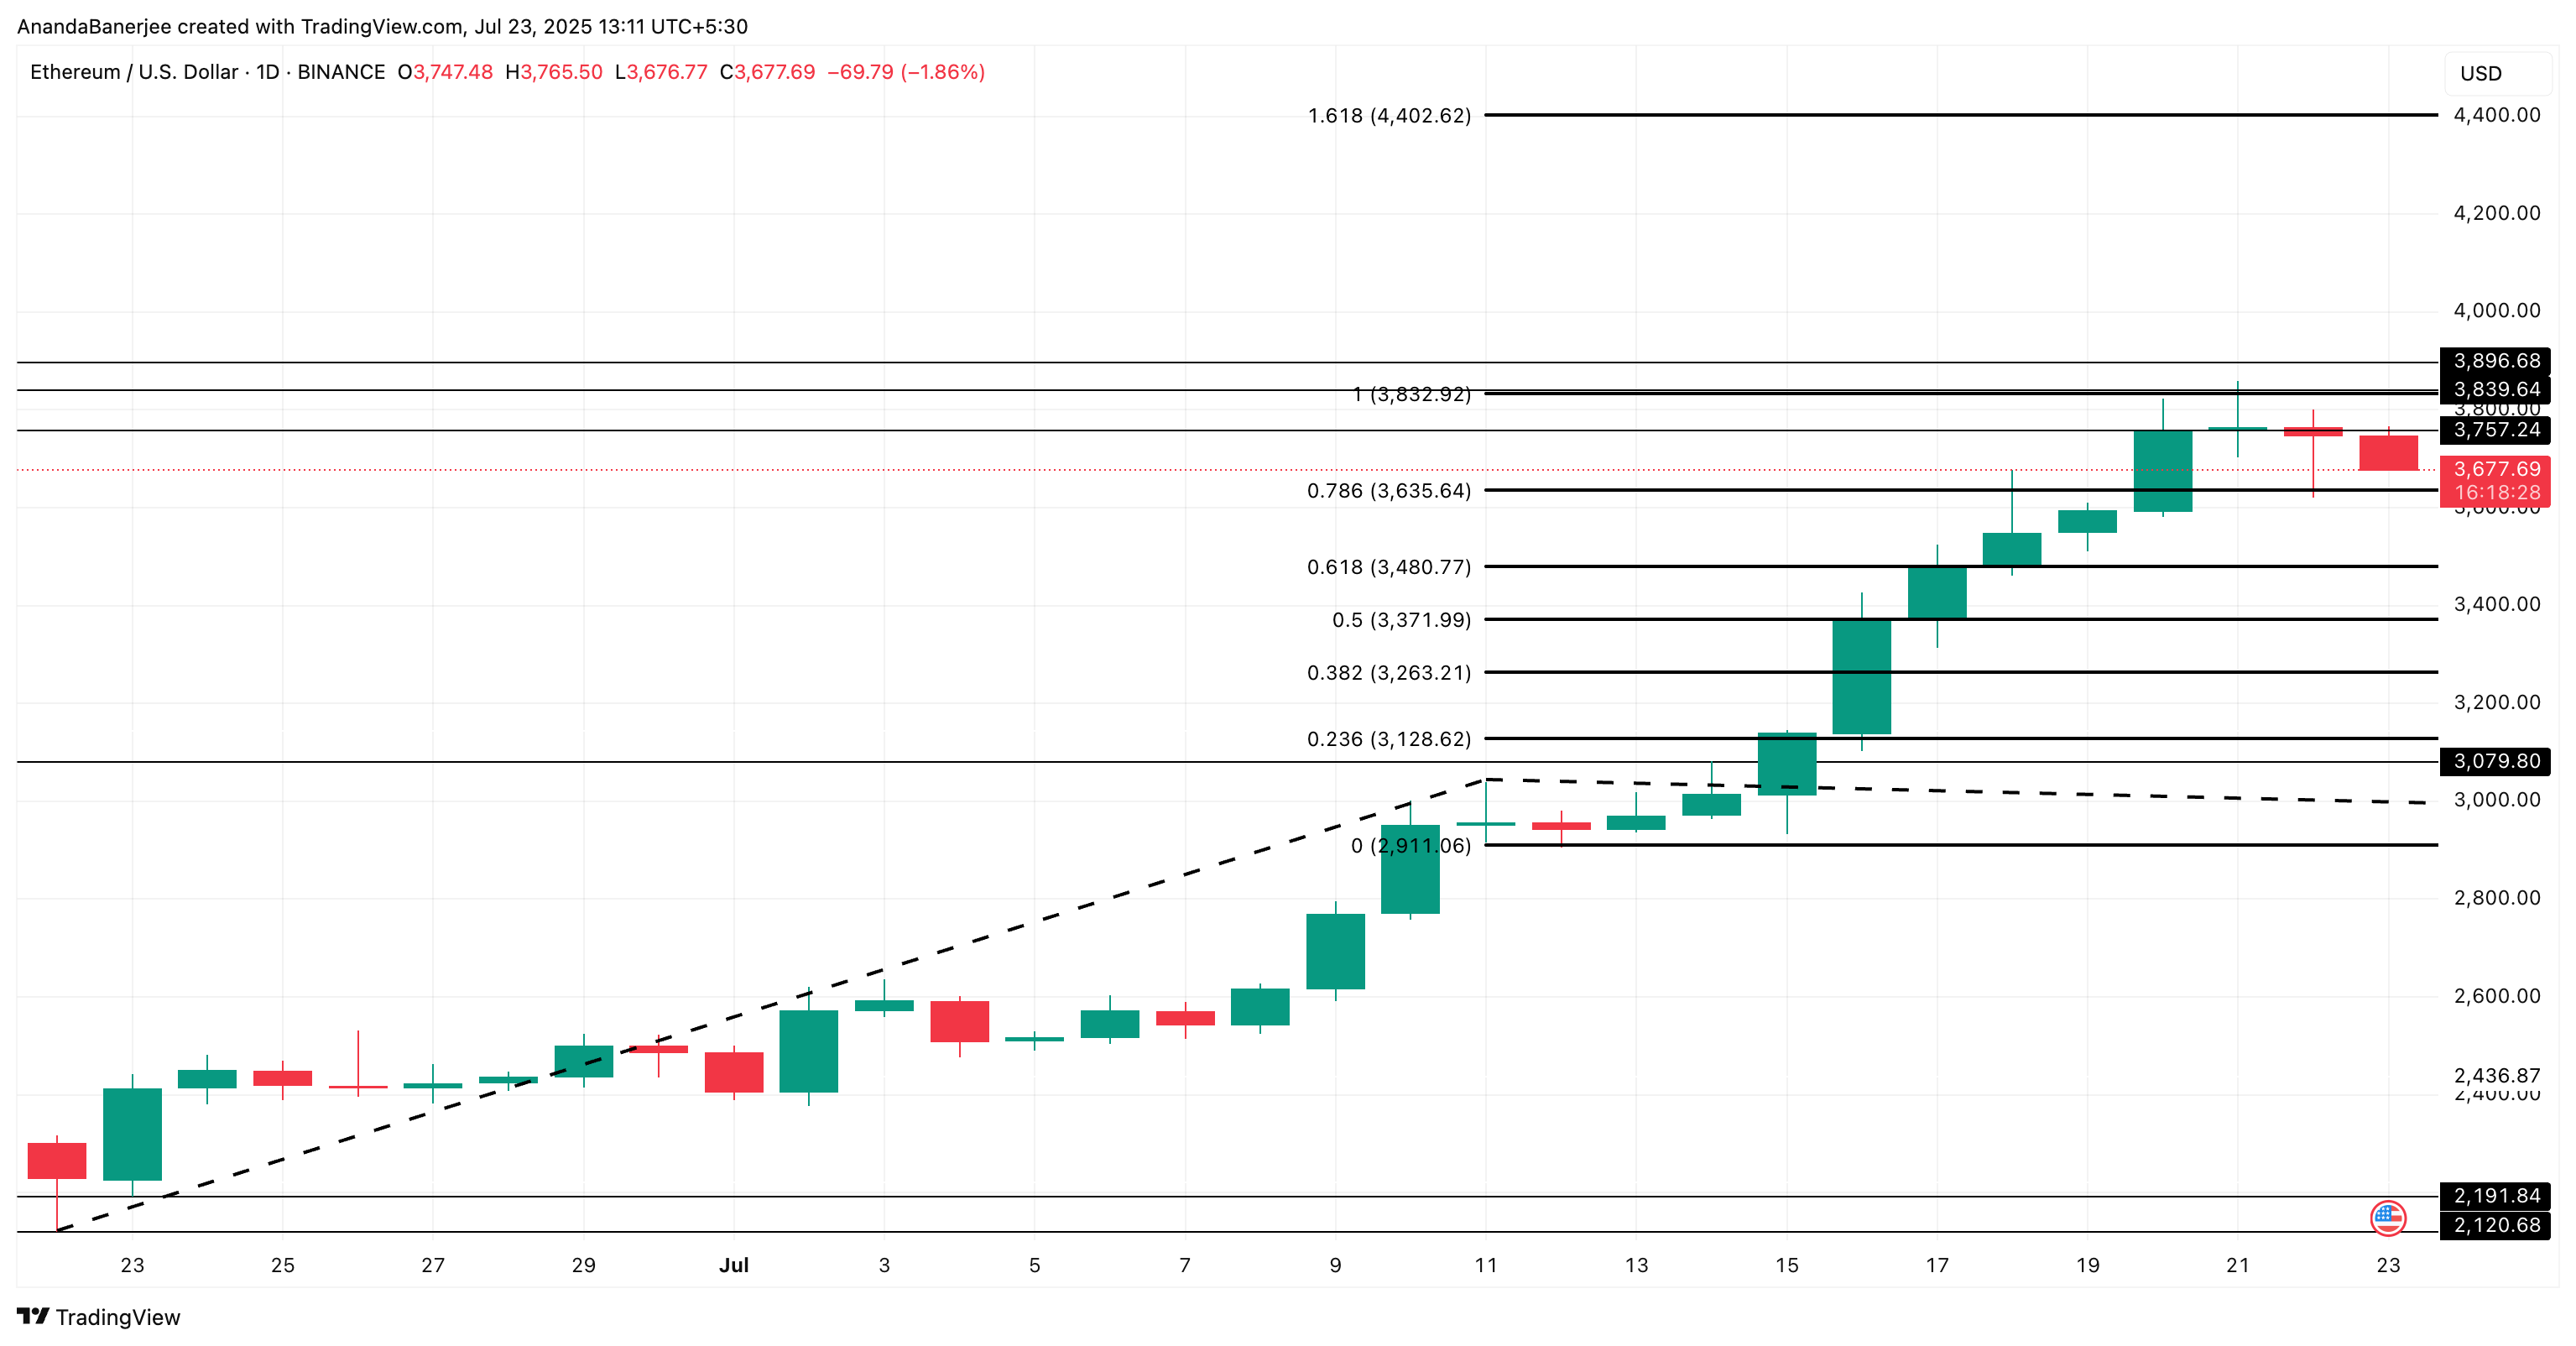
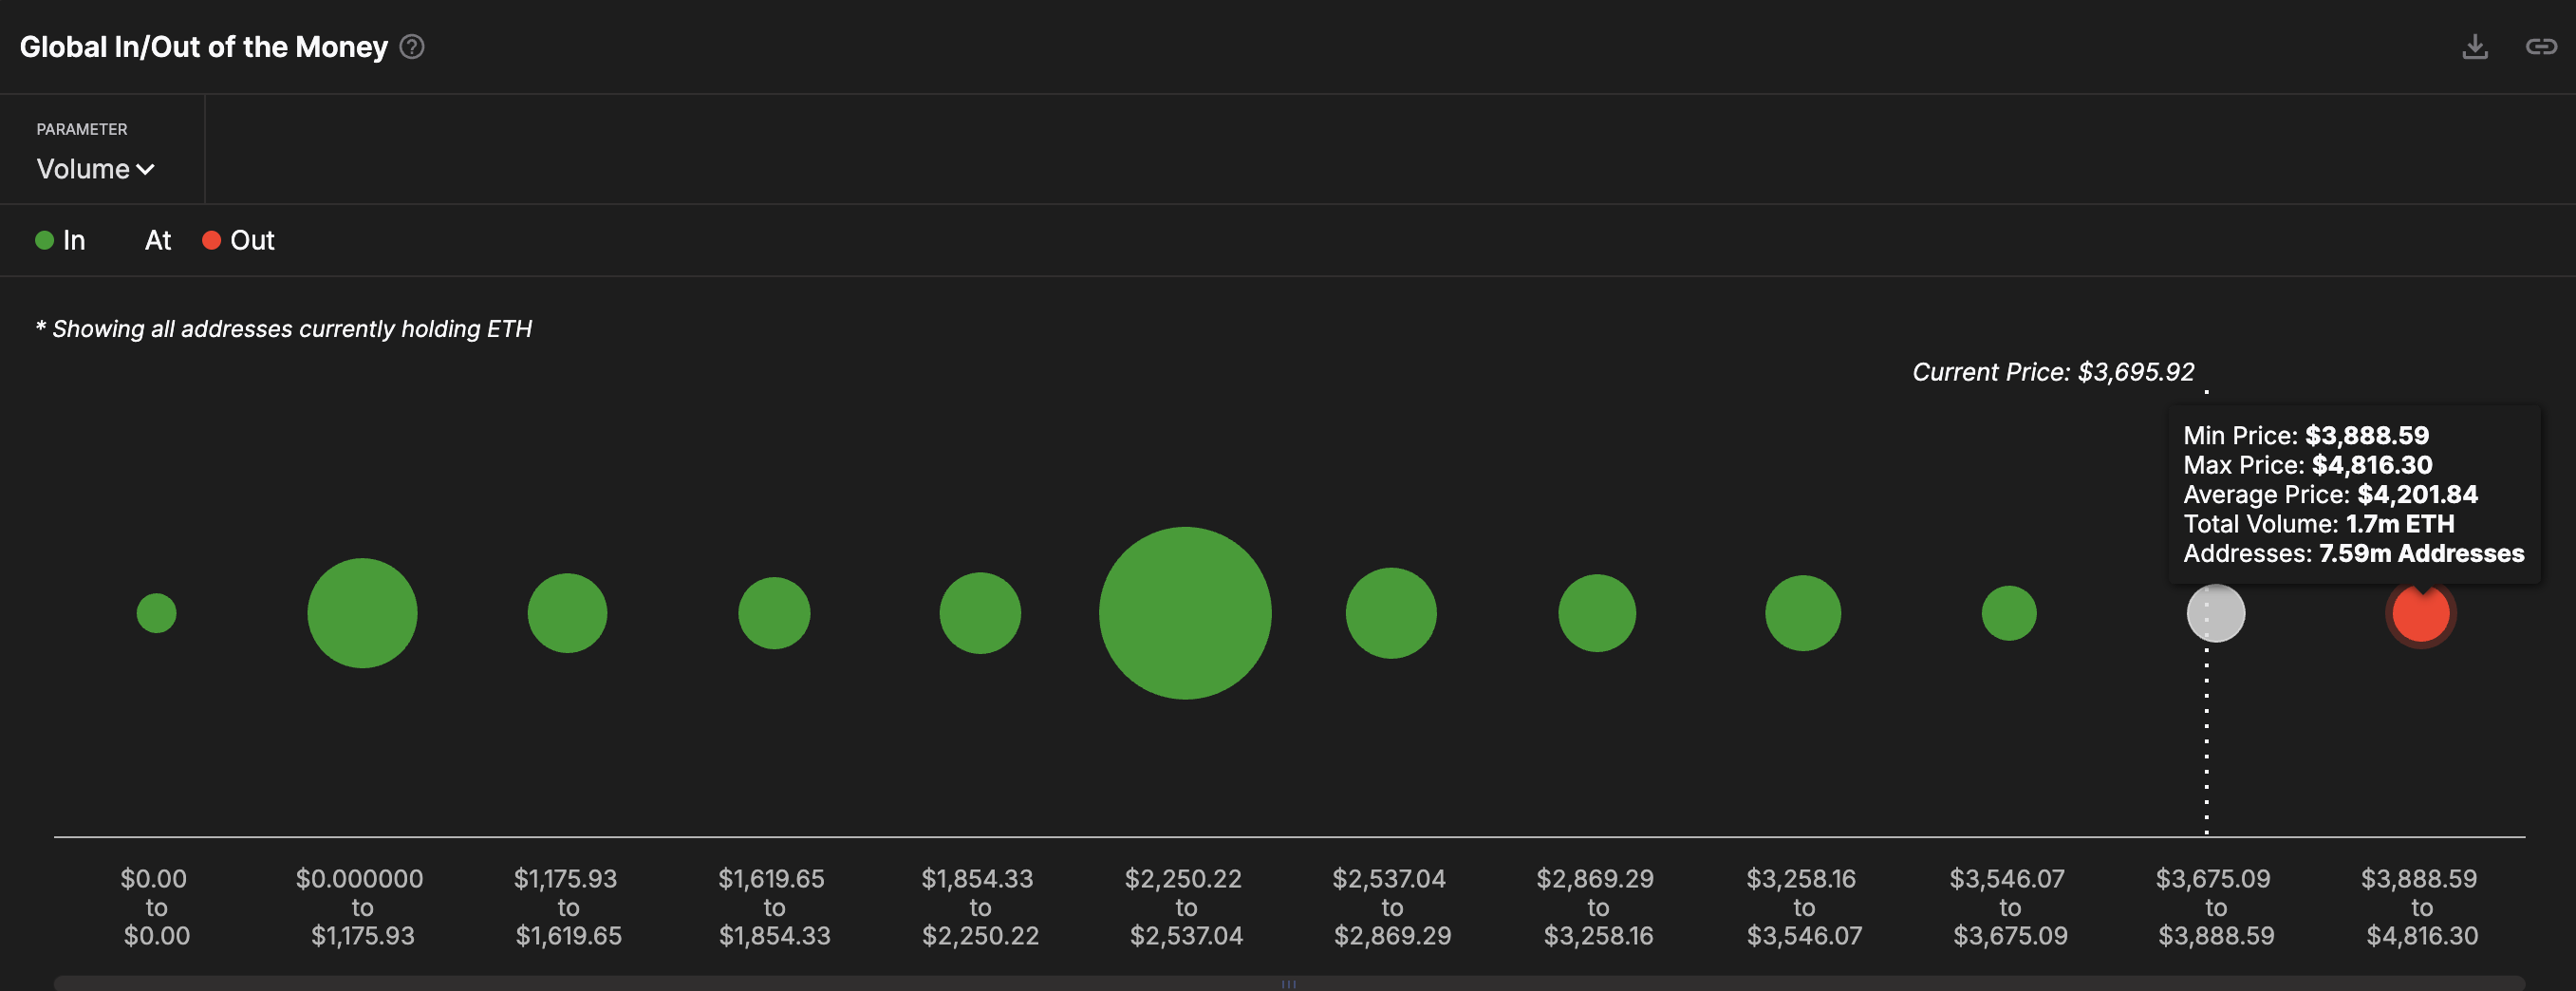
There is a holder cluster above $3,888, which also needs to be breached. That cluster likely explains why quick moves above $3,800 fade; many wallets are near break‑even there and sell into strength.
A daily close above $3,896 would open doors to $4,402 (the 1.618 extension). If ETH corrects again, $3,635 is first support, then $3,480. A drop under those levels, together with a rising ESR, would weaken the bullish setup fast.
Fibonacci levels flag common reaction zones. The in-and-out-of-money map shows where many wallets bought; those areas often act as real resistance or support, validating the Fib levels.
However, the entire short-term bullish hypothesis might get invalidated if the ETH price dips under $3,128 or the 0.238 Fib extension level.
Disclaimer
In line with the Trust Project guidelines, this price analysis article is for informational purposes only and should not be considered financial or investment advice. BeInCrypto is committed to accurate, unbiased reporting, but market conditions are subject to change without notice. Always conduct your own research and consult with a professional before making any financial decisions. Please note that our Terms and Conditions, Privacy Policy, and Disclaimers have been updated.
