
Chainlink (LINK) is back on traders’ radar after a fresh update from veteran trader Matthew Dixon. While most of the crypto market moved sideways this week, LINK price tried to break out, hitting a local high near $15.90 before slipping back to around $15.36.
In his post on X, Dixon broke down what could come next for LINK, and the chart is clearly setting up for a key move. The big question now is whether LINK has enough momentum to push past resistance or if it’s gearing up for a breather.
Looking at the chart, LINK price made a solid reversal from its mid-June low of around $12. Since then, it’s been climbing steadily, printing higher lows and pushing through the resistance it faced back in May and June. That breakout led to the recent push toward $15.90, suggesting bulls still have control, for now.
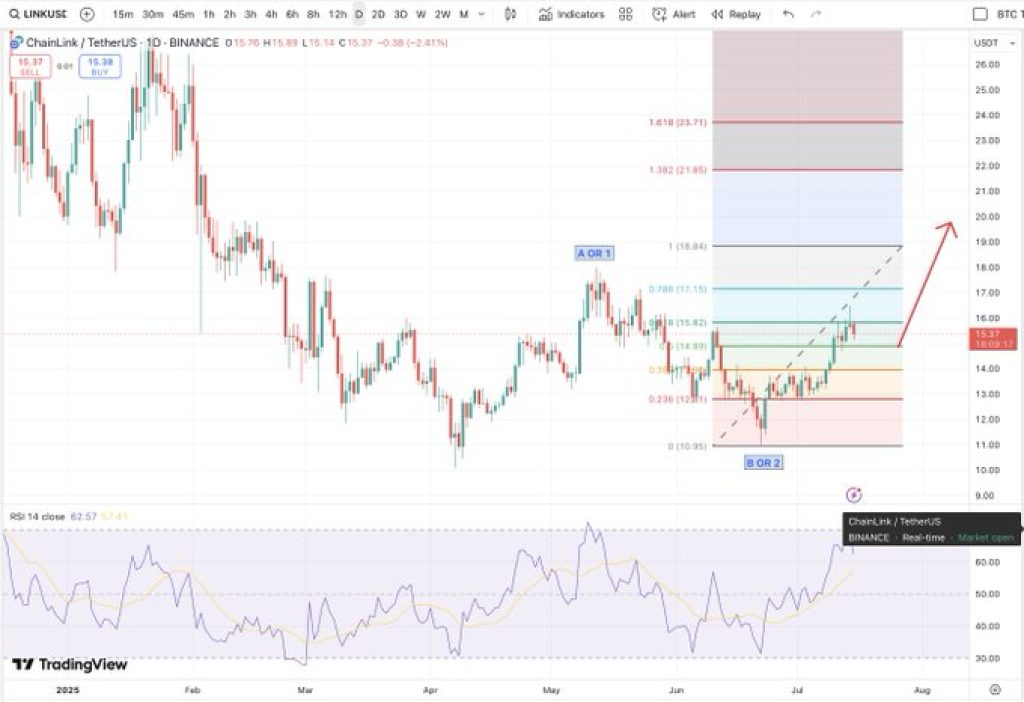
At the moment, Chainlink is pulling back slightly and testing support in the $15.10 to $15.30 zone, which lines up with the 0.236 Fibonacci retracement level of its latest rally. The $14.50 area, where LINK price previously broke out, could serve as the next support if the price dips further.
But if it slips below $14.20 on the daily chart, that could put the bullish setup in danger and shift attention toward the $13.50–$12.50 region as the next support zone.
Chainlink Price Resistance Clusters Show Clear Breakout Targets
Short-term resistance remains around $16.00–$16.20, where LINK has faced rejection twice in July. A confirmed breakout above this zone would open the door toward the May highs between $18.00 and $18.50. This level also aligns with the 1.0 Fibonacci extension target of $18.8.
Above that, the next target rests around $21.9, which corresponds with the 1.272 extension level. A potential third leg could stretch toward $23.7, overlapping with historical resistance in the $24–$25 area. Traders may monitor volume closely at each level, as clean breakouts would require confirmation through sustained participation.
In further support, the single-day Relative Strength Index (RSI) reading is 62.44, up but stabilizing. What this shows is that while bullish energy remains strong, short-term exhaustion is taking effect. A dip into the 55–60 range without losing $14.50 would allow for a reset while maintaining a bullish structure.
Consolidation between $14.50 and $16.00, Dixon noted, would be constructive conditions for further advance. But a breakdown below key supports would put the $12.00–$12.50 base under renewed focus.
Read Also: This SEI Price Break Might Not Be What It Seems – Watch These Levels
LINK Momentum Depends on Volume Confirmation Above $16.20
A break above $16.20 on rising volume could trigger a rally to $18.50 and even $20.00, until which the price can range trade as the market digests recent gains.
The chart supports a constructive setup with Fibonacci extension zones aligning with May levels of resistance and prior structural turning points. The breakdown below $13.50 would undermine the uptrend and make subsequent sessions pivotal for confirmation.
Chainlink price remains in a bullish posture for now, as long as $14.50 holds. Traders will be watching the $16.20 zone closely to determine whether the current momentum has enough strength to push the rally further.
Subscribe to our YouTube channel for daily crypto updates, market insights, and expert analysis.

