
SUI is gaining momentum after breaking above key resistance levels, with price action and liquidity data pointing to a possible move toward $4.40. Analysts tracking the asset cite structural breakouts and clustered sell orders as key drivers behind the current bullish setup. These developments have placed SUI among the most-watched altcoins for a potential move in the coming days.
Crypto expert Michaël van de Poppe and top analyst Chris have shared bullish views on SUI price, though from different analytical angles. Van de Poppe highlighted the broader trend shift and strong ecosystem sentiment, while Chris pointed to visible liquidation levels between $4.10 and $4.40 on the order book.
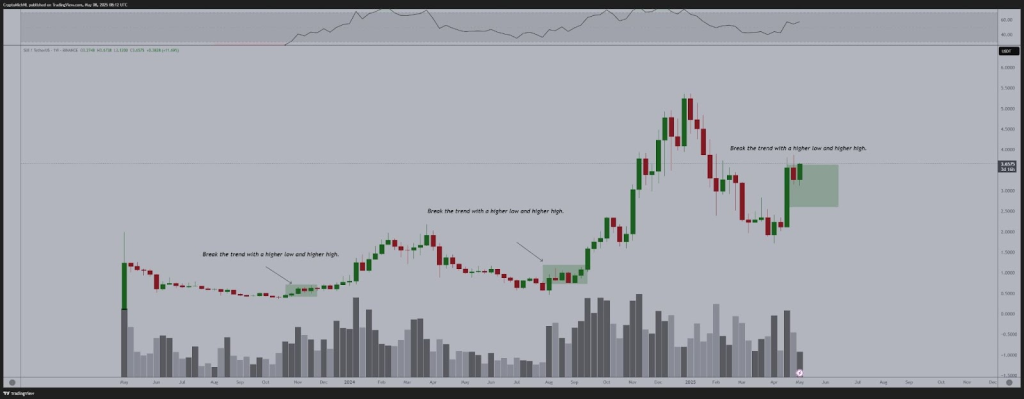
SUI Breakout Structure Suggests New Uptrend
The weekly chart shows that SUI price has broken out of a clear downward structure that persisted for several months. The move is part of a recurring pattern. Previous breakouts in November 2023 and August 2024 led to trend shifts marked by higher highs and higher lows.
Price has advanced approximately 12% this week, trading above $3.65. It moved above a former resistance range of $2.75 to $3.50. The volume supporting this breakout is higher than average, suggesting participation from buyers.
Analysts describe this as a continuation of a longer-term bullish structure with the SUI price next targets near $4.00 and $4.20. The RSI is also trending upward, hovering above 60 but below overbought territory.
Furthermore, Michaël van de Poppe, who visited the SUI Basecamp event, reported high energy among developers and projects building within the SUI ecosystem. He noted a clear breakout from a downward pattern in the charts and consistent growth in total value locked (TVL). He suggested SUI could emerge as one of the stronger performers in the current market cycle.
This sentiment aligns with the technical momentum, as the token’s trend structure confirms a shift after months of consolidation and correction.
Read Also: The $700 Million ADA Mystery: Did Cardano Quietly Seize ICO Funds?
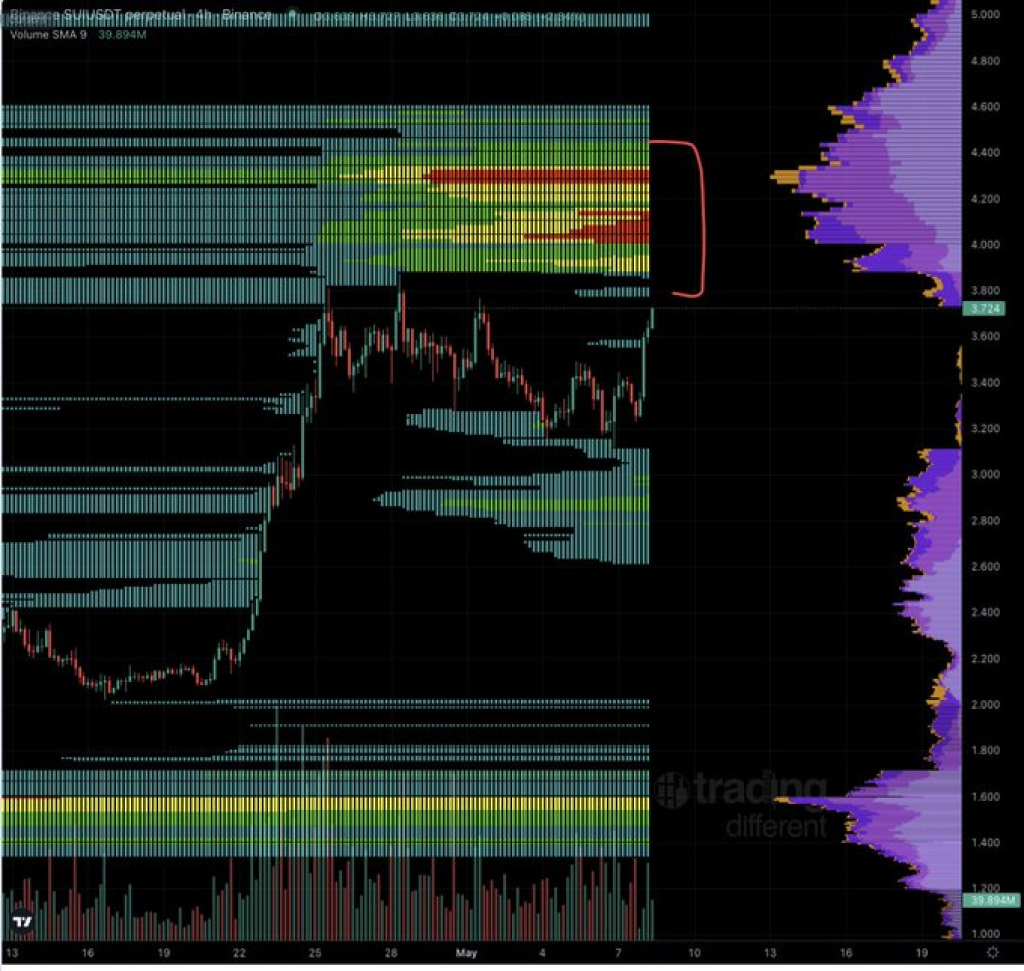
SUI Heatmap Analysis Points to Key Liquidity Zone
A separate chart, shared by Chris, used a heatmap order book combined with volume profile data. It highlighted a dense liquidity zone between $4.10 and $4.40, often referred to as a liquidation cluster. This area contains multiple large sell orders and potential stop-loss levels of short sellers.
SUI price is approaching this zone after a move from a consolidation range near $3.00 to $3.60. The volume profile shows a low-activity region between $3.75 and $4.00. When tokens enter such gaps, price action often accelerates. If SUI breaks through $4.00 with volume, the momentum could trigger a chain reaction of liquidations up to $4.40.
SUI Price Short-Term Levels to Watch
Support now lies near $3.00 to $3.20, which served as a base during recent consolidation. Minor support also exists around $3.50. The $4.10 to $4.40 range could act as short-term resistance. A confirmed breakout above this level may prompt further price exploration toward $5.00 and beyond.
Analysts suggest watching volume and SUI price behavior closely around the $4.00 mark to determine whether the move continues or stalls.
Follow us on X (Twitter), CoinMarketCap and Binance Square for more daily crypto updates.
Read our recent crypto market updates, news, and technical analysis here.

We recommend eToro
Active user community and social features like news feeds, chats for specific coins available for trading.
Wide range of assets: cryptocurrencies alongside other investment products such as stocks and ETFs.
Copy trading: allows users to copy the trades of leading traders, for free.
User-friendly: eToro’s web-based platform and mobile app are user-friendly and easy to navigate.

