Expert Says Dogecoin (DOGE) Price Is Repeating Bullish Pattern – Here’s What Must Happen for a 2x Move

Dogecoin is back on traders’ radar as a familiar bullish pattern shows up again on its chart. Crypto expert Ali spotted what looks like a double bottom, a setup that usually signals a big move upward.
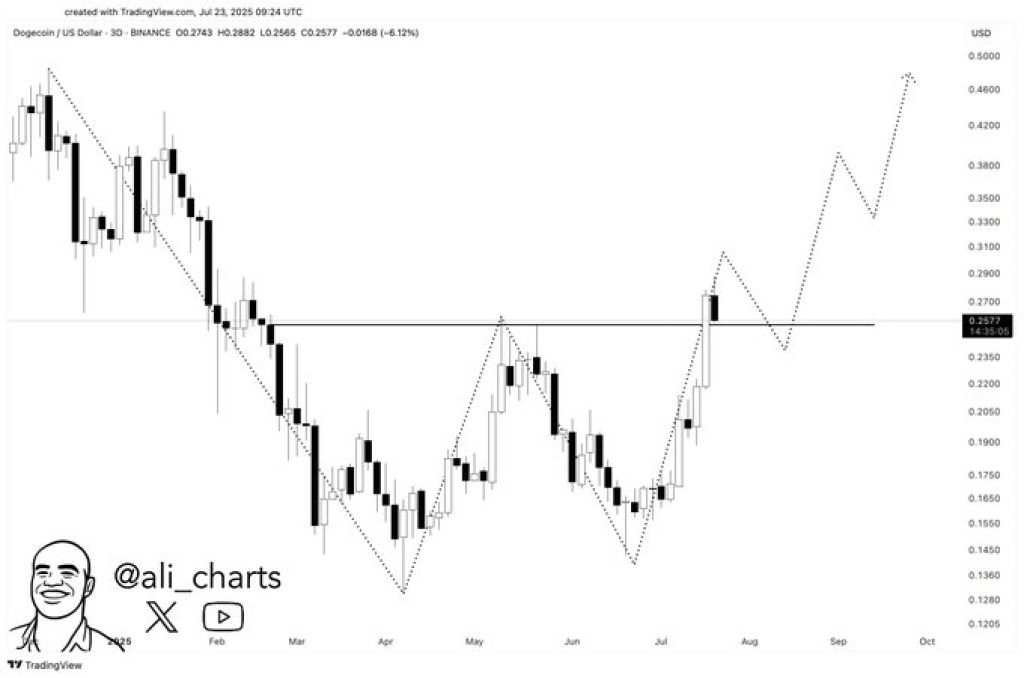
In his latest post, he pointed out that DOGE price is now retesting the $0.27 zone, calling it the “neckline” of the pattern. If the price manages to hold this level, it could be the start of another rally.
Ali’s chart, shared on TradingView, uses a 3-day timeframe and clearly shows a W-shaped formation. If Dogecoin bounces here like it did the last time this pattern showed up, we could see the price aiming for much higher levels soon.
DOGE Chart Shows Retest of Double Bottom Neckline
Dogecoin price is testing a major horizontal level near $0.27. According to Ali’s analysis, this area marks the neckline of a double bottom pattern.
The first low in the structure formed around mid-April, with a second bottom seen in late June. Both price troughs occurred near the $0.13–$0.14 support area, forming the base of the W-pattern.
In late July, DOGE price broke above the $0.27 neckline, briefly extending toward $0.29. Since then, price has pulled back, bringing it back to the neckline. This type of retest is a common feature in double bottom formations. Analysts view it as a potential confirmation level before a new uptrend begins.
Projected Upside Targets and Resistance Levels For DOGE Price
The chart shows a potential bullish continuation scenario with two projected resistance levels. The initial is approximately $0.35–$0.38, which is previous price resistance and also regions of maximum trading volume. On the continuation of momentum, a future breakout would propel DOGE towards the $0.45–$0.50 region.
The current support region is between $0.265 and $0.275. A fall below this level would negate the pattern, while a strong bounce would reconfirm the bull setup. Short-term resistance is visible near $0.30–$0.32 and may create friction before a move toward higher price levels.
Read Also: Peter Schiff Trolls Bitcoiners Again, Says GDX Is Crushing BTC in 2025
Dogecoin Technical Pattern and Momentum
The double bottom pattern on DOGE chart is one of the most widely recognized reversal formations. It often signals exhaustion of a downtrend followed by the formation of a new bullish structure.
For DOGE, the current pattern developed over five months, suggesting a longer-term shift rather than a short-term spike.
Momentum indicators on the chart support the breakout thesis. The stair-step projection shown by Ali suggests higher highs and shallow pullbacks, typical of trending markets.
If the $0.27 neckline acts as support, participants can view this as a relatively low-risk point of entry, with an attractive reward ratio.
In addition, whether Dogecoin can hold the $0.27 level will be something participants will be keenly interested in seeing soon.
With bearish momentum building and a historically healthy pattern intact, the next few sessions may make or break DOGE price higher or back into consolidation.
While volume data is not included in the chart, it will remain a necessary factor for validating any breakout.
Ali’s analysis presents a structured scenario based on historical price action and technical structure. DOGE chart now faces a pivotal test that could shape its path into August.
Subscribe to our YouTube channel for daily crypto updates, market insights, and expert analysis.


