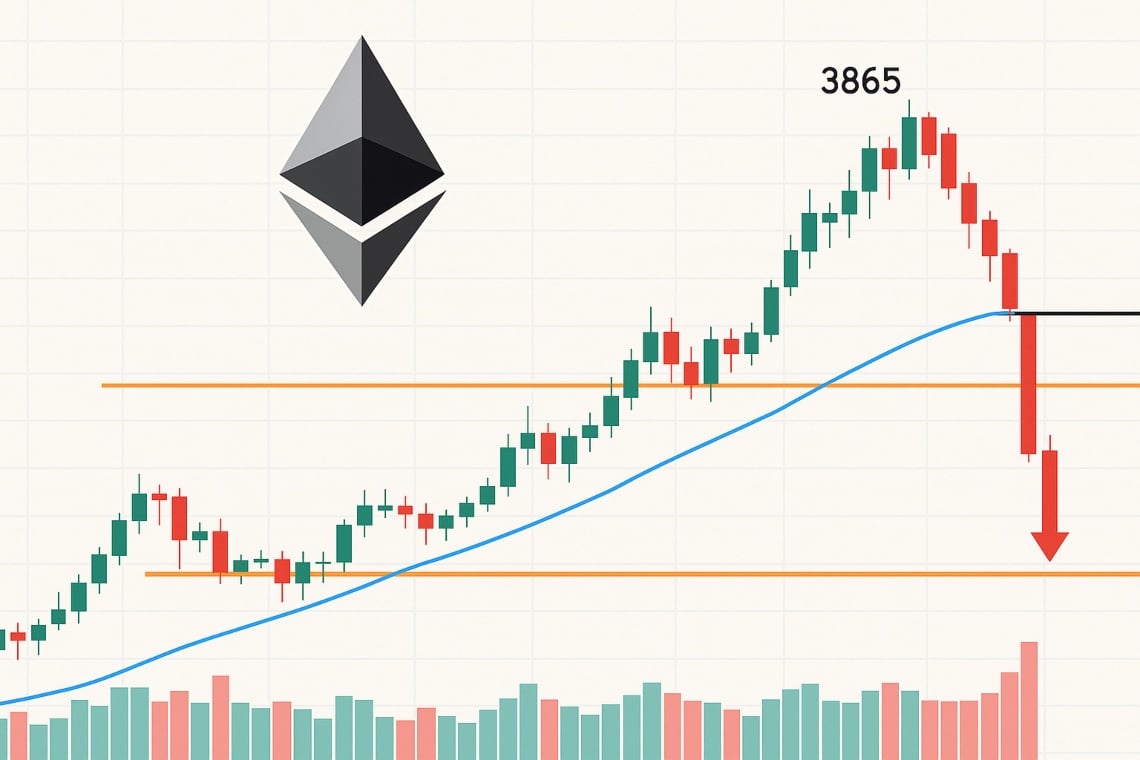
In recent weeks Ethereum (ETH) has run fast, pushing up to the recent highs of 3,865 dollars, but now the market seems to be taking a break.
Whether it is a simple physiological retracement, or the beginning of a deeper corrective phase, is the question that many traders are asking themselves.
In this article, I guide you through a complete technical analysis, explained clearly even for those who are not professionals but want to understand what is happening to the price of ETH. At the end, you will find some practical advice to guide you in your next moves.
Current price context: bullish trend taking a breather for Ethereum
Ethereum continues to show a positive underlying structure: from the June lows, the price has formed higher highs and higher lows, surpassing the 50 and 100 period moving averages without hesitation and pushing beyond the upper Bollinger band.
However, after the peak in the 3,735 dollar area, the latest candle on the 4-hour chart shows a decrease of 1.10%, closing at 3,691 dollars, with lower volumes. A signal that the initial bull momentum may have been exhausted — at least temporarily.
- EMA 50 periods: 3,468 dollars
- EMA 100 periods: 3,204 dollars
The price remains significantly above both, with a considerable distance: the primary trend remains bullish.
These averages will act as dynamic support: especially the EMA50 (3.468) is a key level where many traders might look for a bounce.
During the bull run, ETH has broken through the upper band multiple times, a sign of great strength.
Now the price has returned within the bands, indicating a return to the mean, which is currently around 3,518 dollars. This area is the first natural support zone.
RSI and MACD: momentum in calo
RSI (14)
The relative strength indicator is at 56.9, down from highs over 70.
We are not yet in bear territory (below 50), but the loss of momentum is evident.
MACD
The MACD line remains positive, but the histogram is declining and approaching a bear crossover with the signal line.
A bear crossover could confirm the weakening of short-term momentum.
In the bull phase, the volumes were solid, but in recent days they have decreased.
No peaks of abnormal sales are seen, a sign that we are not yet in a distribution phase, but more likely in a physiological pause.
Key levels to watch
Main supports:
- $3,518: Bollinger bands average
- 3,468 dollars: EMA50
- $3,200–$3,250: EMA100
Immediate resistance:
- 3,735 dollars: local maximum
If the price holds the 3,518–3,468 dollar zone and bounces strongly, the scenario remains bull. However, if it decisively breaks these levels, the next support area is lower, towards 3,200 dollars.
Bull scenario:
If ETH stabilizes above 3,518 and finds increasing volumes, a new attack on recent highs (3,735) is likely, with the possibility of aiming for 3,800–3,850 dollars.
Bear scenario:
If the price breaks 3,468 with increasing volumes to the downside, we might see a deeper correction towards 3,200–3,250 dollars.
- If you are already long, closely monitor the 3,468–3,518 dollar area: it could offer an opportunity to reload positions.
- If you are out of the market, wait for a confirmation signal (rebound or breakout) before entering.
- If you are considering a short operation, wait for the decisive loss of 3,468 with strong volumes.
Why this analysis is important
Because it helps you avoid panicking during retracements and interpret short-term movements as part of a broader context.
The market is still oriented towards a bull trend in the medium term, but caution, especially near local highs, is essential.
The information contained in this article does not constitute financial advice and is for informational purposes only. Investing in cryptocurrencies involves risks and always requires a careful assessment of one’s risk tolerance.
