JHX Elliott Wave forecast [Video]
JHX Elliott Wave technical analysis
Market overview
Today’s Elliott Wave analysis provides an update on the Australian Stock Exchange (ASX), focusing on JAMES HARDIE INDUSTRIES PLC (JHX). Based on current trends, ASX:JHX shares are expected to decline in the medium term. The long strategy requires careful consideration due to existing risk factors. This analysis outlines the potential trend and key price levels to provide both scientific and intuitive insights into market movements.
JAMES HARDIE INDUSTRIES PLC (JHX) Elliott Wave Technical Analysis.
1D Chart (Semilog Scale) Analysis.
Analysis details:
Wave (2) (Orange) is still developing and appears to follow a Zigzag formation. The latest price action has shown prolonged sideways movement, forming what looks like a Triangle labeled Wave B (Grey), which has recently ended. The market is now expected to move into Wave C (Grey), pushing the price lower. If the price falls below 49.16, this will further confirm the bearish outlook.
JHX Elliott Wave technical analysis
TradingLounge (4-Hour Chart).
4-Hour Chart Analysis.
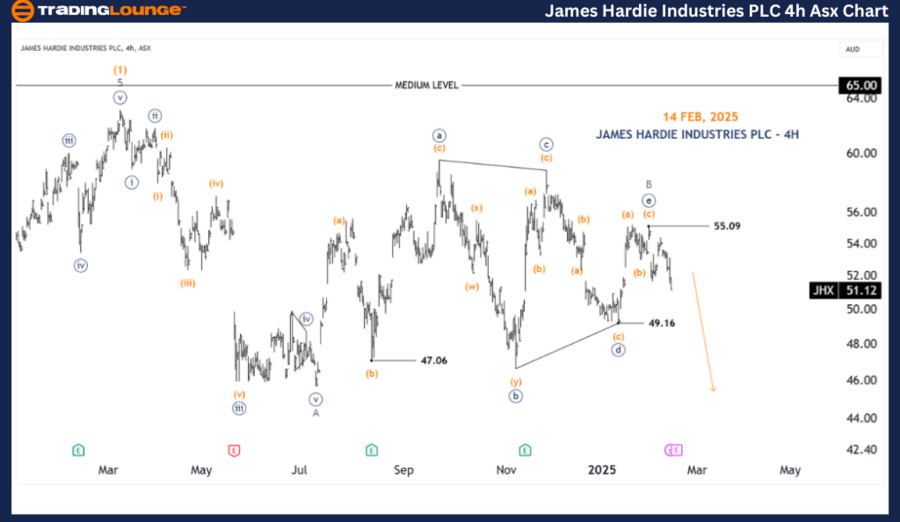
Analysis details:
A closer look reveals that Wave ((e)) (Navy) of Wave B (Grey) has just completed a three-wave Zigzag pattern, reaching a high of 55.09. Based on this, the market is likely to move bearish in the short term. A break below 49.16 would strengthen this bearish outlook.
Conclusion
Our Elliott Wave forecast provides a structured approach to analyzing JAMES HARDIE INDUSTRIES PLC (JHX) market trends, offering insights for traders looking to capitalize on price movements. We highlight critical price levels that serve as confirmation or invalidation signals, reinforcing confidence in our projections. By integrating these factors, we aim to provide the most objective and professional perspective on current market trends.
Technical analyst: Hua (Shane) Cuong, CEWA-M (Master’s Designation).

