
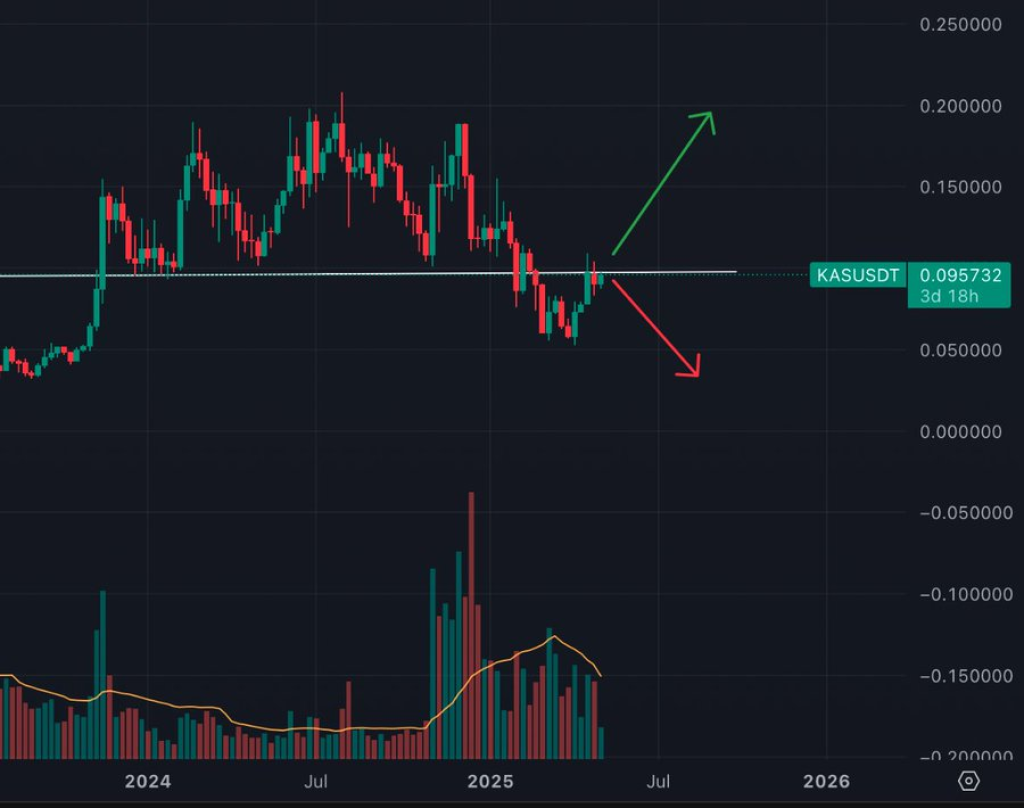
The Kaspa (KAS) chart is flashing a serious warning sign for both bulls and bears. After a lengthy period of sideways movement and failed breakouts, KAS has returned to test a familiar level. The price is now hovering around $0.095, which puts it just below the psychological and technical barrier at $0.10. This is the zone that has acted as both solid support and firm resistance for some weeks.
What happens here could shape the next few months for Kaspa price. A successful reclaim of the $0.10 area could bring back bullish momentum and even send the price toward the $0.15 or $0.20 zone.
But if it gets rejected again, the structure might confirm a deeper downside, possibly setting up a larger correction. The chart shows a clear divergence and the market is waiting for confirmation.
Why the $0.10 Level Matters
According to Kaspa Daily, this is not just a simple resistance test. The chart is showing signs of what could be a Wyckoff Distribution model. This model is a classic framework used to describe how large investors distribute their holdings after an extended uptrend. The structure includes phases where price goes flat, then fakes out the crowd with a rally before breaking down sharply.
In Kaspa’s case, the price went through a choppy range in 2024, hitting several highs and lows without making a true breakout. That range could represent Phase B of the distribution. The brief breakout above $0.14 that quickly failed might have been the UTAD, the upthrust after distribution, which usually tricks late buyers into entering before the market turns lower.
The breakdown below $0.10 earlier in 2025 might have marked the beginning of Phase D, where selling pressure ramps up. If this is accurate, and we are now in Phase E, a decisive rejection at $0.10 would confirm that a larger downtrend has already started.
Kaspa Price at a Crossroads: A look through Wyckoff theory perspective. 🧵👇
1/ The Wyckoff method is a time-tested framework used to understand how markets move through phases of accumulation, distribution, and trend. It focuses on the behavior of supply and demand and helps… pic.twitter.com/j8HWp8llpy
— Kaspa Daily (@DailyKaspa) March 9, 2025
But there’s a flip side to the story. Wyckoff’s method also includes the possibility of re-accumulation, where the market pauses during an overall bullish trend. In that case, the same range structure can appear, but the outcome is very different.
Instead of distribution, the range would be a zone where long-term buyers quietly accumulate more tokens before another rally. In this scenario, the shakeout below $0.10 would be part of Phase C, designed to flush out weak hands. A successful reclaim of $0.10 followed by strong price action would suggest we’ve moved into Phase D of re-accumulation, where buyers begin stepping in aggressively.
Volume Adds Another Layer to the Picture
The volume profile on the Kaspa chart adds more insight. During the breakdown below $0.10 earlier this year, there was a clear spike in volume. That move could either represent panic selling in a distribution phase or a forced shakeout in a re-accumulation phase.
Read Also: How High Can Kaspa (KAS) Go This Bull Run? Analyst Weighs In
Since then, volume has remained elevated but less aggressive. If KAS reclaims the $0.10 zone with high volume, that would be a strong sign that buyers are stepping back in. But if it stalls with rising sell volume, it could be the final confirmation of further downside.
So now, it all comes down to this moment. Kaspa price is sitting on the edge. Bulls need to reclaim $0.10 convincingly, or the bearish thesis becomes much harder to deny. Either way, volatility is likely to spike soon. The only question is whether the move will be up or down.
Follow us on X (Twitter), CoinMarketCap and Binance Square for more daily crypto updates.
Read our recent crypto market updates, news, and technical analysis here.

We recommend eToro
Active user community and social features like news feeds, chats for specific coins available for trading.
Wide range of assets: cryptocurrencies alongside other investment products such as stocks and ETFs.
Copy trading: allows users to copy the trades of leading traders, for free.
User-friendly: eToro’s web-based platform and mobile app are user-friendly and easy to navigate.

