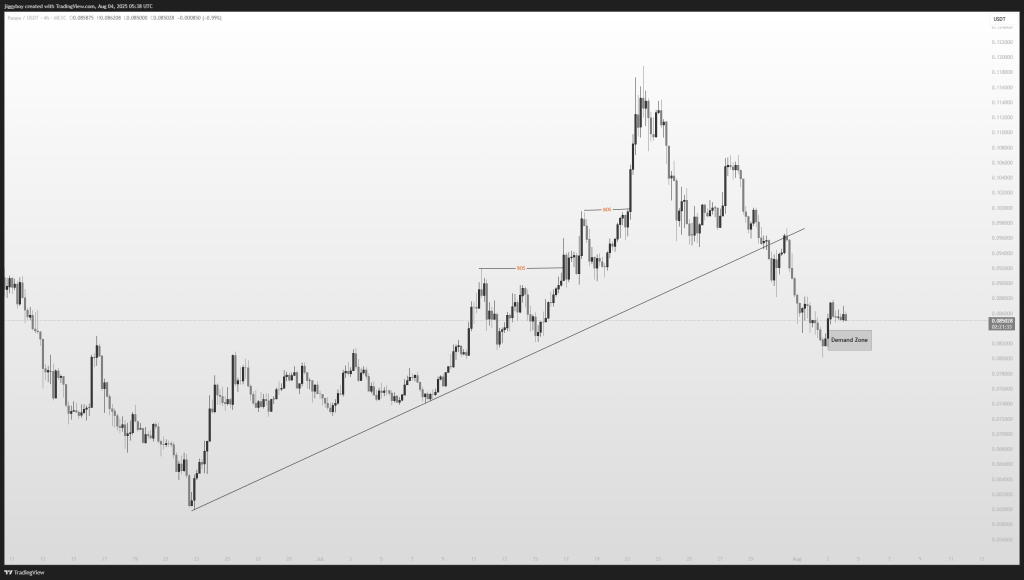
Kaspa is still stuck in a tight range today after sliding from its recent highs. Right now, the token is holding around $0.085, sitting inside a key demand zone.
Momentum feels weak, and while sellers still have the upper hand, MACD is hinting at a possible small bounce if buyers step in.
After losing its upward trendline on July 28–29, KAS price hasn’t been able to climb back above $0.090. The big question now is whether the $0.082–$0.085 support area can keep holding or if bears will push the price lower.
Let’s break down what’s happening today.
📅 What We Got Right Yesterday
Yesterday we pointed out that the $0.082–$0.085 demand zone was the area to watch. We also warned that if it broke, the next move could take KAS price down toward $0.077.
So far, that zone has done its job. Price bounced slightly and is just hovering around $0.085. There hasn’t been any real breakout attempt, and the market is basically moving sideways, with resistance still up near $0.090.
📊 Kaspa 4-Hour Overview (August 4)
- Current Price: $0.085
- 24h Change: -0.99%
- 4H RSI (14): 46.82 – Neutral
- Trend: Weak and slightly bearish
The 4H chart shows Kaspa price cooling off after that sharp drop from $0.122. The candles are small and tight, a sign of indecision. Sellers are still present, and buyers haven’t done enough to get price back above the broken trendline.
🔍 What the Kaspa Chart Is Showing
KAS price is still in short-term bearish mode with lower highs forming since the end of July. Price is stuck in the $0.082–$0.085 range, and a break below could quickly take it to $0.077 or even $0.070 if the selling pressure picks up.
Volume is light, and the market feels quiet. For any real recovery, KAS needs to push above $0.090. That could spark a move toward $0.095–$0.10 and give bulls something to work with.
📈 Technical Indicators (Hourly Timeframe)
| Indicator | Value | Signal / Interpretation |
|---|---|---|
| MACD (12,26) | 0 | Early bullish signal |
| ADX (14) | 18.25 | Weak trend |
| CCI (14) | -140.23 | Bearish pressure, oversold zone |
| RSI (14) | 46.82 | Neutral momentum |
| ROC (Rate of Change) | -0.516 | Mild selling pressure |
| Bull/Bear Power (13) | -0.0015 | Bears slightly dominant |
Most of the indicators are still leaning bearish. The MACD is the only one showing an early sign of life for buyers, but the overall trend is weak.
🔮 Kaspa Price Prediction Scenarios
Bullish Scenario:
If KAS can penetrate above $0.090, it could make a push to $0.095–$0.10. A close back above $0.10 would provide some momentum for bulls.
Neutral Scenario:
If the $0.082 support holds, Kaspa rice will just keep chopping back and forth between $0.082 and $0.090 for a while.
Bearish Scenario:
If $0.082 breaks, KAS could quickly fall to $0.077. If sellers stay in control, $0.070 might even come into play.
🧠 Wrapping Up
Kaspa price is in a quiet spot right now, stuck between support and resistance. Momentum is thin and the market is waiting for a decisive shift. Traders are watching closely the $0.082–$0.085 range because whichever way the price breaks next will likely set the direction of the next short-term action.
Read Also: GROK Predicts AAVE Price in August
Subscribe to our YouTube channel for daily crypto updates, market insights, and expert analysis.