Kaspa price is still stuck in that familiar range, hovering just below the 100-day moving average and struggling to break out. The price is sitting at $0.08886 right now, not far from yesterday’s high of $0.090, but bulls just can’t seem to push it through.
Momentum is mixed, volume’s quiet, and price action is choppy. So the big question remains: will Kaspa finally clear $0.091, or are we heading back toward support again?
📅 What We Got Right Yesterday
In yesterday’s prediction, we talked about how $0.090–$0.091 was the line in the sand for bulls. That still holds true, Kaspa price touched $0.090 but couldn’t close above it.
We also said that if $0.082 held, we’d likely stay in a sideways pattern between $0.082 and $0.090. And that’s exactly how things played out, no breakout, no breakdown, just more ranging.
📊 Kaspa Daily Snapshot (August 8)
- Current Price: $0.08886
- 24h Change: +1.06%
- Volume: Stable but quiet
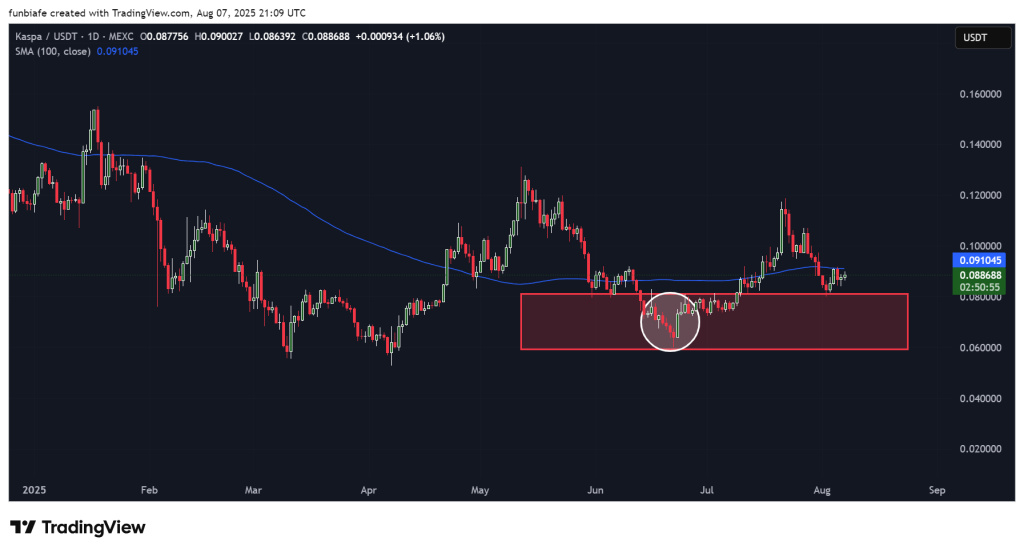
Kaspa price is still pinned under the 100-day SMA at $0.091, which has been a wall for the past week. On the other side, support around $0.080 is holding steady, backed by the strong demand zone between $0.065 and $0.080.
🔍 What the Kaspa Chart is Telling Us
The Kaspa chart shows that it has been bouncing between key levels since mid-July. After failing to hold above the 100-day SMA, the price dropped into the support zone, but buyers defended it well, especially around $0.070.
That red box between $0.065 and $0.080 has been a magnet for accumulation. KAS price keeps bouncing out of it, but without enough firepower to make a full breakout. If KAS can close above $0.091, the next stop could be $0.095 or even $0.10.
Right now, though, it’s all small candles and low volume, classic signs of indecision. Bulls need volume to step in, or we’re just going to keep chopping sideways.
📈 Key Technical Indicators (Daily)
| Indicator | Value | Signal |
| MACD (12,26) | 0 | Bullish crossover forming – early signal |
| ADX (14) | 21.75 | Weak trend – no strong direction right now |
| CCI (14) | -50.63 | Light bearish pressure |
| RSI (14) | 48.30 | Neutral – no strong buying or selling |
| Ultimate Oscillator | 51.95 | Slight bullish lean |
| Bull/Bear Power (13) | -0.0036 | Slight edge to sellers |
Summary: Indicators are all over the place. MACD and the Ultimate Oscillator look a bit bullish, but ADX shows the trend is still weak. RSI and CCI are both neutral, leaning slightly bearish.
🔮 Kaspa Price Scenarios
Bullish Scenario:
If Kaspa can finally break above $0.091 with some real volume, we could see a push toward $0.095 and maybe even $0.10–$0.11.
Neutral Scenario:
If KAS price holds $0.082 and we can’t break above resistance, price likely stays in this range between $0.082 and $0.090 a little longer.
Bearish Scenario:
If KAS drops under $0.082, the next targets are $0.077, with lower support waiting at $0.070 and $0.065.
🧠 Bottom Line
Kaspa price is still in a tight range with neither bulls nor bears winning. Sideways chop is still the most likely result until we can get a decisive break above $0.091 or a fall below $0.082.
Keep an eye on volume and price action near those levels, it’ll tell you where this goes next.
Read Also: ChatGPT Compares Kaspa Infrastructure With Ethereum and Solana
Subscribe to our YouTube channel for daily crypto updates, market insights, and expert analysis.