
Kaspa price is pulling back modestly today, some $0.1126 after it was turned back at the region of $0.118, an important resistance zone which has kept its footing since last November.
Despite the pullback, KAS remains well over 50% higher from July lows, and the trend remains bullish. The new trend that started last week is continuing, with KAS price remaining above the 9-day moving average and posting higher highs and higher lows.
Kaspa now sits just below a long-term descending trendline, and traders are watching to see if bulls can push through, or if the token will stall again.
Let’s take a closer look at today’s setup.
📅 What We Got Right Yesterday
In yesterday’s prediction, we talked about the $0.118–$0.120 zone being a key test for Kaspa and that if bulls couldn’t break it, the price might stall or pull back.
That’s exactly what happened. KAS prcie touched $0.1188, got rejected hard, and slid back toward $0.112. The move fits the idea we shared: consolidation between $0.105 and $0.117 is likely unless we see a strong breakout.
📊 Kaspa Daily Snapshot (July 23)
- Current Price: $0.1126
- 24h Change: -1.71%
- Volume: Moderately high
Kaspa price is still well above the 9-day moving average at $0.0969, which means momentum hasn’t fully faded. But after such a strong push this month, a bit of sideways action or a dip wouldn’t be surprising.
🔍 What the Kaspa Chart is Telling Us
Kaspa daily chart shows price getting squeezed under a descending resistance line that’s been around since November 2024. Every rally since then has been stopped right around this trendline, and this week’s rejection continues that pattern.
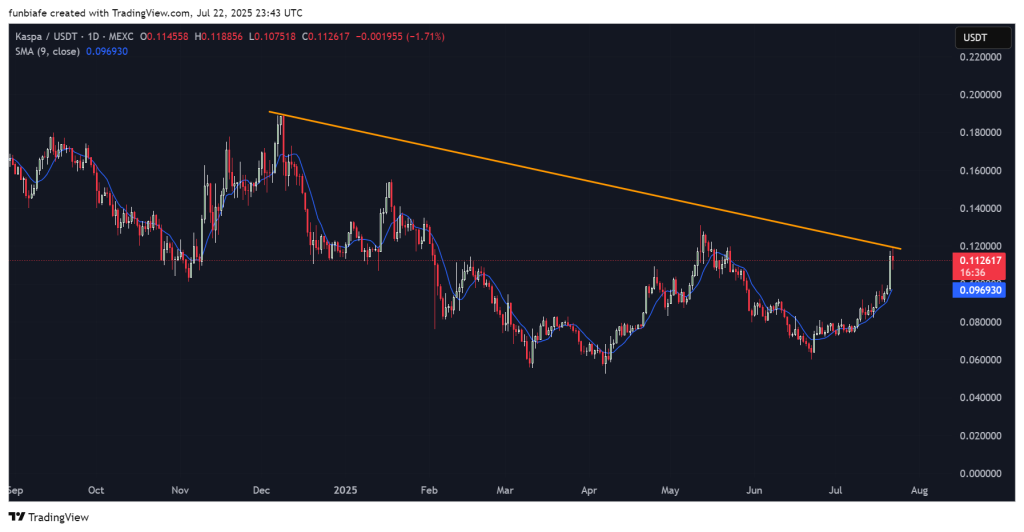
The uptrend is still intact for now. But unless KAS breaks above $0.120 with real volume, a pullback toward $0.098 or even $0.090 could be in play. The candles are also starting to look a little weaker, small-bodied and with some hesitation.
📈 Technical Indicators (Daily Timeframe)
| Indicator | Value | Signal / Interpretation |
| RSI (14) | 76.19 | Overbought, pullback risk |
| ADX (14) | 59.37 | Strong trend, supports upside |
| MACD (12,26) | 0.007 | Bullish crossover, upward momentum |
| CCI (14) | 225.06 | Overbought, stretched move |
| Ultimate Oscillator | 62.97 | Moderate buy pressure |
| Bull/Bear Power (13) | 0.0365 | Bulls still in control |
Summary: Bulls are still favored by momentum, but both RSI and CCI are in overbought territory. Without a breakout at $0.120, we can expect a halt or short-term drop
🔮 Kaspa Price Prediction Scenarios
Bullish Scenario:
If KAS breaks and closes above $0.120, we could see a fast run toward $0.135–$0.140. That’s the clean breakout bulls are waiting for.
Read Also: Solana Breaks $200, Kaspa is a Top Crypto Gainer – Market on the Move
Neutral Scenario:
If KAS price just hovers between $0.105 and $0.117, that means we’re consolidating, no breakout, but no breakdown either.
Bearish Scenario:
If we break down below the 9-day moving average ($0.0969), it will likely drag back to $0.090, or $0.085.
🧠 Final Thoughts
Kaspa price is looking strong, but it just hit a serious ceiling. Indicators are stretched, and that trendline has been tough to break in the past.
The big question now: does KAS break through $0.120, or does it cool off for a bit? All eyes are on that zone. Until then, expect a little sideways action as the market figures out its next move.
Subscribe to our YouTube channel for daily crypto updates, market insights, and expert analysis.


