
Kaspa is cooling off after a strong rally earlier this month. The price is now hovering around $0.104, down more than 7% from its recent peak near $0.114.
After a clean breakout above long-term resistance, KAS price is now testing short-term support, and what happens next could set the tone for the rest of the week.
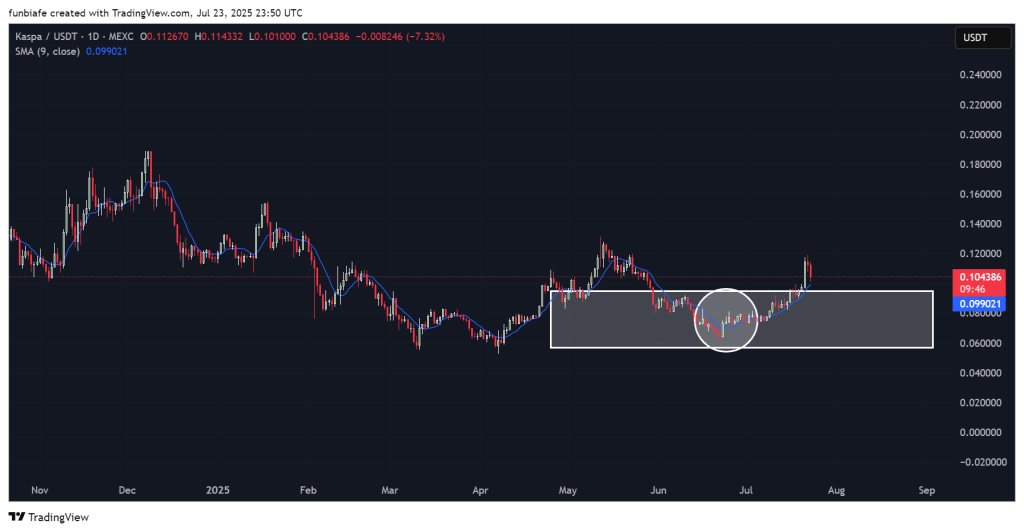
The token broke out of a long consolidation range between $0.065 and $0.088, made a strong push higher, but is now showing signs of slowing down. Let’s take a closer look at where things stand today.
📅 What We Got Right Yesterday
In yesterday’s outlook, we said that $0.120 was the breakout level to watch for bullish continuation. That breakout didn’t happen, instead, KAS price rejected around $0.114 and started to pull back.
We also mentioned the 9-day moving average (then near $0.0969) as a key level. If price dipped below that, we expected a move toward $0.090 or $0.085. So far, that hasn’t happened, the SMA is still holding as short-term support.
KAS has mostly stayed within the $0.105–$0.117 range we talked about, with no clear move up or down, for now, it’s a waiting game.
📊 Kaspa Daily Snapshot
- Current Price: $0.104
- 24h Change: -7.32%
- 9-day SMA: $0.099
- Volume: Cooling off after the recent rally
KAS price is holding just above the 9-day SMA after slipping from recent highs. The former breakout zone between $0.065 and $0.088 remains the major support area if this pullback deepens.
🔍 What the Kaspa Chart Is Telling Us
Kaspa formed a nice rounded bottom before breaking out in early July. That breakout ran into resistance near $0.114, and since then, we’ve seen a healthy pullback.
Right now, KAS price is sitting on top of its rising 9-day SMA. If buyers hold the line here, the uptrend can continue. But if that level fails, price could drift back toward the old consolidation range.
Volume is lower, and candles are getting smaller, a sign of indecision. Bulls are trying to hold the trend, but they haven’t fully regained control yet.
📈 Key Technical Indicators
| Indicator | Value | What It Means |
| RSI (14) | 64.71 | Strong, but not overbought |
| ADX (14) | 59.42 | Very strong trend |
| MACD (12,26) | 0.007 | Bullish crossover |
| CCI (14) | 136.24 | Strong upward momentum |
| Ultimate Oscillator | 56.42 | Still showing buyer interest |
| Bull/Bear Power (13) | 0.0214 | Bulls still have the edge |
Summary: All of these indicators are still flashing buy. There’s momentum behind the move, but that momentum needs to be protected at these levels.
Read Also: Kaspa vs SEI Speed Test: Which Crypto Project Is Truly Faster?
🔮 What Could Happen Next
Bullish Scenario:
If KAS can break above $0.120, the next leg could take it to $0.135 or $0.140.
Neutral Scenario:
If Kas price stays between $0.105 and $0.117, expect more sideways action.
Bearish Scenario:
If KAS closes below the 9-day SMA around $0.099, it might drop toward $0.090 or even $0.085.
🧠 Final Thoughts
Kaspa price is at a key spot on the chart. The rally has paused, and the market is waiting to see if the bulls can hold the trend.
Right now, the 9-day moving average is acting as the line in the sand. Hold it, and the uptrend stays alive. Lose it, and we may be heading back toward earlier support.
Subscribe to our YouTube channel for daily crypto updates, market insights, and expert analysis.

