Kaspa is cooling off after a strong move earlier this month. The price is also at about $0.0944, below its 9-day moving average, and momentum has started to slow somewhat. While the overall trend is still bullish, short-term indications are mixed, and the market seems to be waiting for a clearer direction.
The breakout from the July base was impressive, but now KAS price is stuck in a range. Traders are watching to see if it can regain its footing and push higher, or if a deeper pullback is coming.
📅 What We Got Right Yesterday
In yesterday’s prediction, we pointed out that $0.103 was a key level to watch. If Kaspa could break above it and hold, the next targets were $0.117 and potentially $0.125. That breakout didn’t happen.
Instead, KAS price stayed between $0.093 and $0.103, just like we expected. Volume stayed light, and there was no strong follow-through from buyers. So far, this range is holding steady.
We also mentioned that if $0.093 breaks, the next stops could be $0.085 or even the July base near $0.067. That hasn’t played out yet, but those levels remain on the radar.
📊 Kaspa Daily Overview (July 30)
- Current Price: $0.0944
- 24h Change: -2.32%
- SMA (9-day): $0.1027
Kaspa price is now trading below its short-term moving average, which is acting like a ceiling for the price. It’s still well above the old accumulation zone between $0.058 and $0.078, so the bigger picture remains intact, for now.
🔍 What the Kaspa Chart Is Telling Us
The Kaspa daily chart shows a pullback after a strong rally. Price is forming lower highs and hasn’t been able to climb back above the 9-day SMA. That line now acts as short-term resistance.
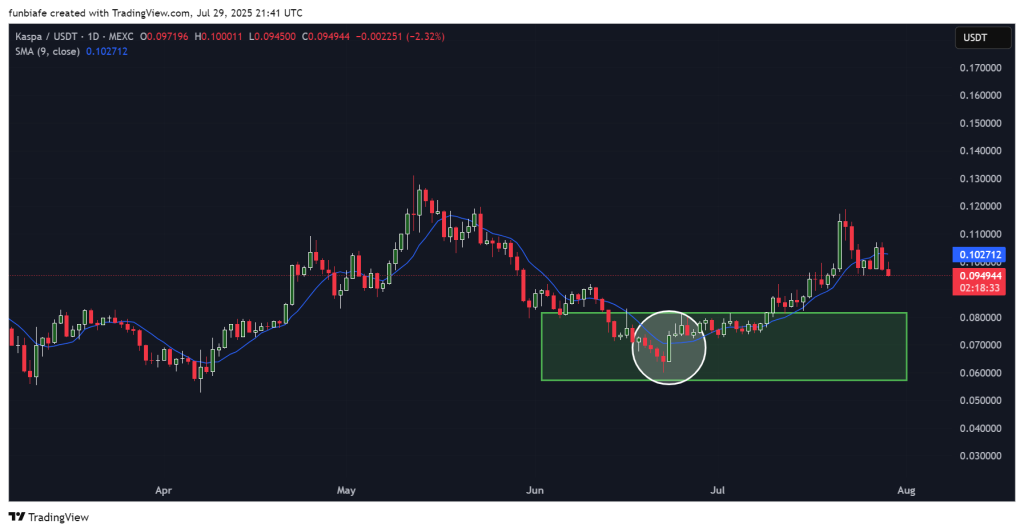
Volume is thinning out, and candles are getting smaller, which usually means a bigger move is coming soon, but the direction isn’t clear yet. If $0.093 breaks, we could revisit $0.085 or even deeper levels from earlier this summer.
📈 Key Indicators (Daily Timeframe)
| Indicator | Value | What It Means |
| RSI (14) | 51.65 | Neutral – no strong momentum |
| ADX (14) | 44.73 | Buy – trend strength still solid |
| MACD (12,26) | 0.005 | Buy – mild bullish signal |
| CCI (14) | -34.60 | Neutral – no real pressure |
| Ultimate Oscillator | 40.95 | Sell – momentum is fading |
| Bull/Bear Power (13) | -0.0015 | Sell – bears have a slight edge |
Summary: Some indicators still support the uptrend, like ADX and MACD. But others, like the Ultimate Oscillator and Bear Power, suggest the buying momentum is slowing down.
🔮 KAS Price Scenarios to Watch
Bullish Scenario:
If upward movement returns, a break above $0.103 could take it to the $0.117 or even $0.125 levels. But volume needs to come in for that to happen
Neutral Scenario:
If things stay neutral, Kaspa price will likely continue to range between $0.093 and $0.103 until a catalyst shakes it loose.
Bearish Scenario:
If bears do take over, a break down below $0.093 might take the price all the way back to $0.085 or even into the $0.067 range where it consolidated in early July.
Read Also: Kaspa Open Interest Rises as Traders Position for Next Move
🧠 Final Take
Kaspa price is in a wait and see phase. It’s holding above key support, but it hasn’t done enough to confirm a new rally.
For now, traders are watching that $0.093–$0.103 range closely. A clean break on either side will probably decide what comes next.
Subscribe to our YouTube channel for daily crypto updates, market insights, and expert analysis.