Kaspa (KAS) Price Prediction for Today (June 26)

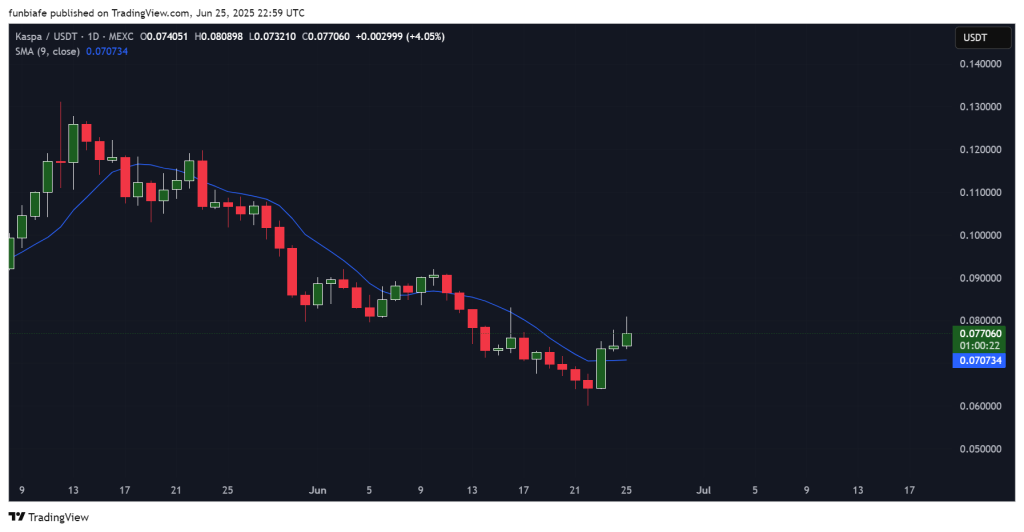
Kaspa is showing early signs of recovery after weeks of downward pressure. It has been up 4.78%, and it’s currently trading at $0.07697.
The price has broken above the 9-day moving average and is now holding above former resistance, which has flipped into short-term support. While momentum appears to be building, buyers still face strong resistance near the $0.080 level.
After that solid breakout on June 24, Kaspa price has been putting in higher lows, which is usually a good sign the downtrend might be turning around.
But today’s candle shows some hesitation near the top of the range, hinting that the bulls aren’t fully in charge just yet.
Let’s take a closer look at today’s setup.
📅 What We Got Right Yesterday
In yesterday’s prediction, we highlighted the importance of the $0.076 level and suggested that a break above it could lead to a move toward $0.080.
That scenario played out, with KAS price reaching as high as $0.080898 before meeting some resistance. Price is now consolidating above the 9-day SMA, which we also identified as a key level to hold for continued bullish momentum.
We also noted that a rejection near $0.080 could cause KAS to move sideways between $0.070 and $0.075. While the breakout held, today’s upper wick hints at that same pressure returning.
📊 Kaspa Daily Overview (June 26)
- Current Price: $0.077060
- 24h Change: +4.05%
- Daily Range: $0.073210 – $0.080898
- Volume: Building, but not yet decisive
Kaspa is currently trading just above short-term support, with a solid candle body and a higher high. While bulls have maintained momentum for now, the price is struggling to stay above $0.080. The $0.070–$0.072 zone is now acting as short-term support.
If KAS price can break and hold above $0.083, the next key zone to watch is $0.090–$0.100, which acted as a strong reversal point earlier this year.
🔍 What the Kaspa Chart Is Showing
The downtrend that began in mid-May was broken with a strong bullish candle on June 24. That move pushed KAS price above the 9-day SMA for the first time in weeks, also suggesting buyers are regaining confidence.
Today’s candle posted a higher low and a higher high, but the upper wick signals some profit-taking around the $0.081 level.


Price is now consolidating just above short-term support, and the next two candles will likely determine whether this bounce continues or fades back into range.
Right now, the structure leans bullish as long as KAS stays above $0.070.
📈 Technical Indicators (Daily Timeframe)
| Indicator | Value | Signal / Interpretation |
| ADX (14) | 26.735 | Strengthening trend, early bullish bias |
| MACD (12,26) | 0.001 | Mild bullish crossover |
| CCI (14) | 10.6133 | Neutral, no extreme trend |
| Ultimate Oscillator | 51.326 | Slight bullish sentiment |
| ROC (Rate of Change) | 4.731 | Strong short-term upside momentum |
| Bull/Bear Power (13) | 0.0009 | Slight buying pressure |
Summary: Most indicators are flashing early buy signals. ADX shows a trend forming, and ROC and MACD support short-term momentum. CCI remains neutral but stable.
🔮 Kaspa Price Prediction Scenarios
Bullish Scenario:
Kaspa may move toward $0.090 or even $0.100 if it can close above $0.080, which would support the idea that the trend is reversing.
Neutral Scenario:
Kaspa price may consolidate between $0.070 and $0.075 until volume increases if it keeps stalling below $0.080.
Bearish Scenario:
The setup may be upset and the price may fall back below $0.063 or even $0.060 if Kaspa falls below $0.067.
Read Also: Kaspa Price Bounces Off Multi-Year Support: New All-Time High Expected Soon
🧠 Wrapping Up
Kaspa price is holding its ground above the 9-day SMA, with bulls showing signs of strength after a clean breakout. Resistance around $0.080, nevertheless, continues to be a barrier.
Kaspa will most likely continue to move sideways between $0.070 and $0.080 for the time being. A clear breakout or breakdown should set the next direction.
Subscribe to our YouTube channel for daily crypto updates, market insights, and expert analysis.

