PENGU price, the meme coin tied to Pudgy Penguins, has been on an impressive run lately. From the end of June to just a few days ago, PENGU price rallied by over 400%.
While that kind of surge might make some traders expect a cooldown or long consolidation phase, a new chart posted by well-known crypto analyst Ali suggests that the uptrend may not be over yet. In fact, Ali believes that PENGU could be gearing up for another leg higher.
Let’s take a closer look at what Ali is seeing on the charts and why the Pudgy Penguins price could be setting up for another move.
PENGU Price Action Shows Signs of Strength
According to the chart shared by Ali (@ali_charts), PENGU price is showing several bullish technical signals that may hint at an incoming rebound. First, the asset is now trading at the lower boundary of a visible descending channel. Historically, this area often acts as a support zone where price reversals can begin, and that’s exactly what Ali points out here.
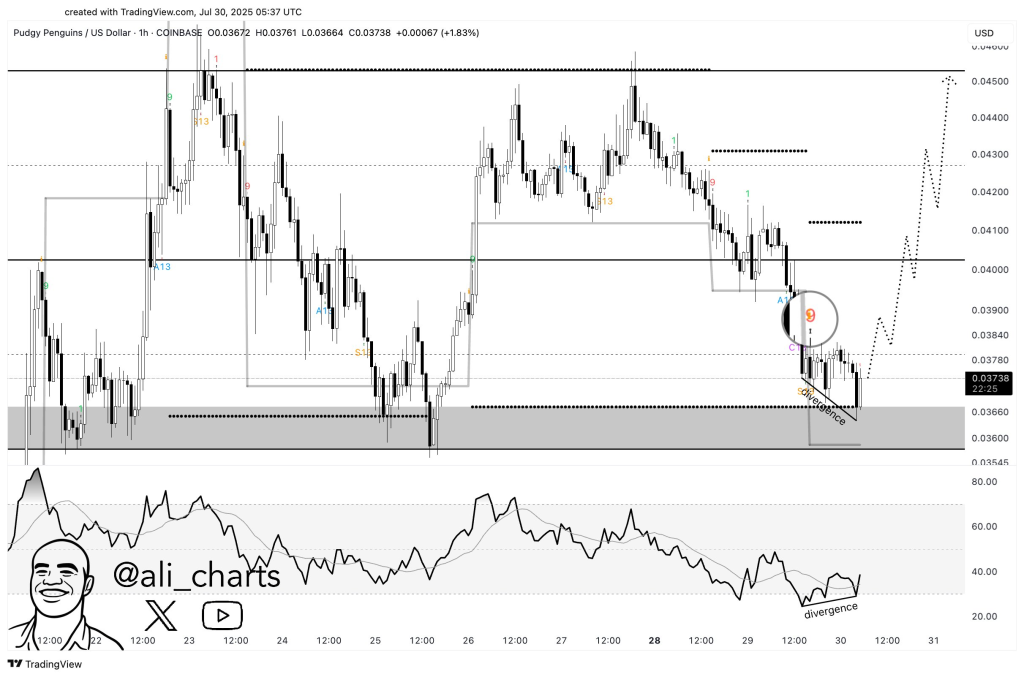
In addition to this, the TD Sequential indicator, which is used to time trend reversals, has just flashed a new buy signal. On the chart, this appears as a red “9” candle, which has often marked major turning points in previous PENGU price movements.
Interestingly, this “9” came in right at the lower boundary of the channel and near a zone that had previously served as a support cluster. This overlap strengthens the signal even more.
RSI Divergence Adds to the Bullish Setup
Another key detail in Ali’s chart is the appearance of bullish divergence on the Relative Strength Index (RSI). While the PENGU price has made a lower low, the RSI has formed a higher low. This kind of divergence often suggests that selling pressure is weakening and that buyers could be preparing to take control again.
Ali marks this RSI divergence clearly at the bottom of the chart. It lines up with the price hitting a key support area, adding one more reason to believe that a bounce might be coming soon. Historically, RSI divergences have been reliable signals across various assets, especially when combined with other tools like the TD Sequential.
Here’s Why This Could Be the Start of a New PENGU Rally
Based on Ali’s analysis, all the signs are pointing to a possible breakout for the PENGU meme coin. The TD Sequential buy signal, the support zone at the bottom of the channel, and the RSI divergence together create a strong case for a rebound. The chart even shows a dotted projection of a potential price path, which leads PENGU up toward the $0.045 region if the move plays out.
Read Also: XRP Community Eyes Mid-August Pump as Ripple Legal Case Nears Final End
Ali has made it clear in his post that this could be a turning point for Pudgy Penguins price. “$PENGU looks ready to rebound,” he wrote, adding that multiple bullish signals are aligning.
As it stands, the PENGU price is hovering around $0.037, but traders will be watching closely to see if it can break above short-term resistance around $0.040 and start building momentum toward higher levels.
Subscribe to our YouTube channel for daily crypto updates, market insights, and expert analysis.