
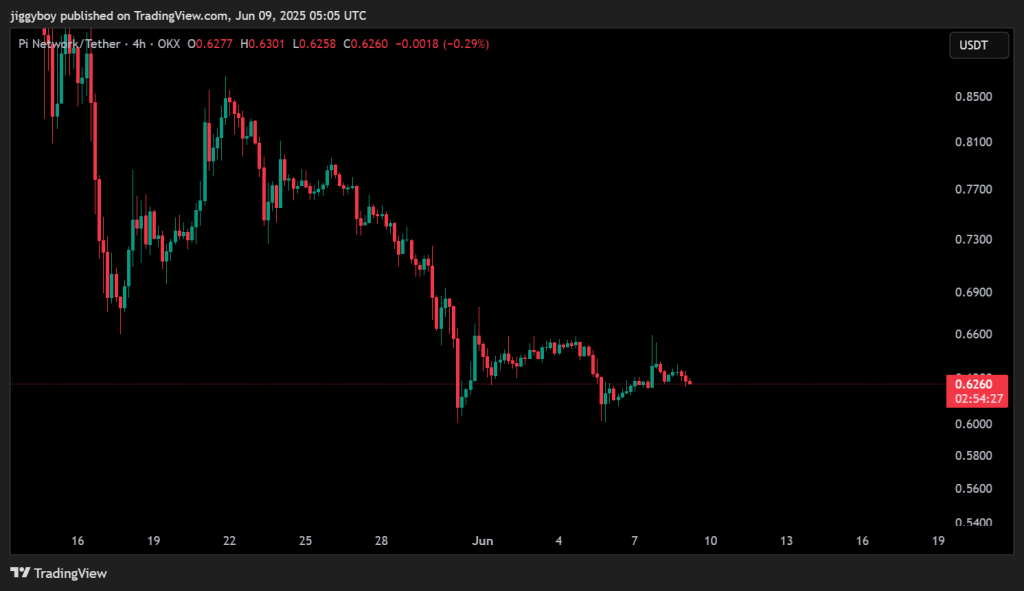
Pi Coin continues to consolidate following a steep downtrend that began in mid-May. After sliding from above $0.85 to the current price of $0.6266, the token has entered a phase of low volatility and limited momentum. Price is moving in a tight horizontal range between $0.61 and $0.66, while trading volume is down by 32.85%, reflecting hesitation across the market.
Let’s break down today’s outlook.
📅 What We Got Right Yesterday
Yesterday’s outlook outlined three possible price paths: bullish, neutral, and bearish. So far, the neutral scenario is unfolding, with Pi Coin price hovering between $0.61 and $0.64. This range has held firm for several days now, confirming that both buyers and sellers are currently in balance.
We also flagged the $0.66 level as a key resistance to watch. Despite a brief attempt to break higher, the price failed to close above this threshold. This validates the current sideways movement and reinforces the idea that a stronger breakout catalyst is still missing.
📊 Pi Coin Daily Overview (June 9)
- Current Price: $0.6266
- 24h Change: -0.95%
- Hourly RSI: 42.19
- Trading Volume: Down 32.85%
Pi Coin price action on the 4H chart remains confined within a consolidation channel. The $0.61–$0.62 zone continues to serve as support, while the upper boundary near $0.66 remains unbroken. A lack of strong candles and fading volume signals a wait-and-see mood among traders.
🔍 What the Pi Coin Chart Is Showing
The recent price pattern points to a bearish consolidation following weeks of decline. After falling from the $0.85 level, Pi Coin has not shown signs of a confirmed reversal. Lower highs and lower lows are still visible on the larger structure, and unless buyers reclaim $0.66 with conviction, another dip remains possible.
Volume has dropped during this sideways range, which typically precedes a breakout. Traders are watching to see if the token will test lower supports or finally build strength for a move upward.
📈 Technical Indicators (Hourly Timeframe)
| Indicator | Value | Signal / Interpretation |
| RSI (14) | 42.19 | Weak momentum, leaning bearish |
| MACD (12,26) | -0.001 | Bearish crossover, low intensity |
| ADX | 15.85 | Weak trend strength, sideways market |
| CCI (14) | -107.46 | Bearish pressure, oversold territory |
| Ultimate Oscillator | 35.50 | Negative momentum, no buy pressure |
| ROC (Rate of Change) | -1 | Gradual decline, bearish signal |
| Bull/Bear Power (13) | -0.0046 | Slight bearish control |
Summary: Momentum indicators are stacked to the bearish side, though none signal an imminent breakdown. The overall tone remains soft, with no directional momentum building yet.
🔮 Pi Coin Price Prediction Scenarios
Bullish Scenario: A 4-hour candle close above $0.66 could open short-term upside toward $0.70–$0.73, but volume confirmation is required.
Neutral Scenario: The Pi Coin price may continue moving sideways between $0.61 and $0.66, with weak participation on both sides.
Bearish Scenario: A confirmed breakdown below $0.61 could expose $0.60 and possibly lead to a drop toward $0.58.
🧠 Wrapping Up
Pi Coin price is in a low-momentum zone with mixed signals. Price has stabilized after a prolonged decline, but bears still maintain a slight edge. Traders are monitoring the $0.61 support and $0.66 resistance closely. Until either level breaks, sideways movement remains the most probable short-term path.
Read Also: Here’s Why Internet Computer (ICP) Price Is Pumping
Follow us on X (Twitter), CoinMarketCap and Binance Square for more daily crypto updates.
Read our recent crypto market updates, news, and technical analysis here.

We recommend eToro
Active user community and social features like news feeds, chats for specific coins available for trading.
Wide range of assets: cryptocurrencies alongside other investment products such as stocks and ETFs.
Copy trading: allows users to copy the trades of leading traders, for free.
User-friendly: eToro’s web-based platform and mobile app are user-friendly and easy to navigate.

