
Whoever is holding Pi coins can be fairly happy with the price action since the launch on February 20th. Price had its ups and downs and for the past week or so it’s been trading in the $1.60 to $2.00 range.
We took a look at Pi Coin/USDT chart and analyzed where the price could go from here.
The chart shows a symmetrical triangle pattern, formed by converging trendlines. Pi Coin has been consolidating between support and resistance lines, forming lower highs and higher lows as it approaches a breakout decision point.
The support line is visible as the lower purple trendline that moves upward from left to right. This represents the area where buyers typically step in, preventing the price from falling further. Each time Pi Coin touches this line, it bounces back up, showing strong demand at those levels. Currently, this support zone sits around $1.80.
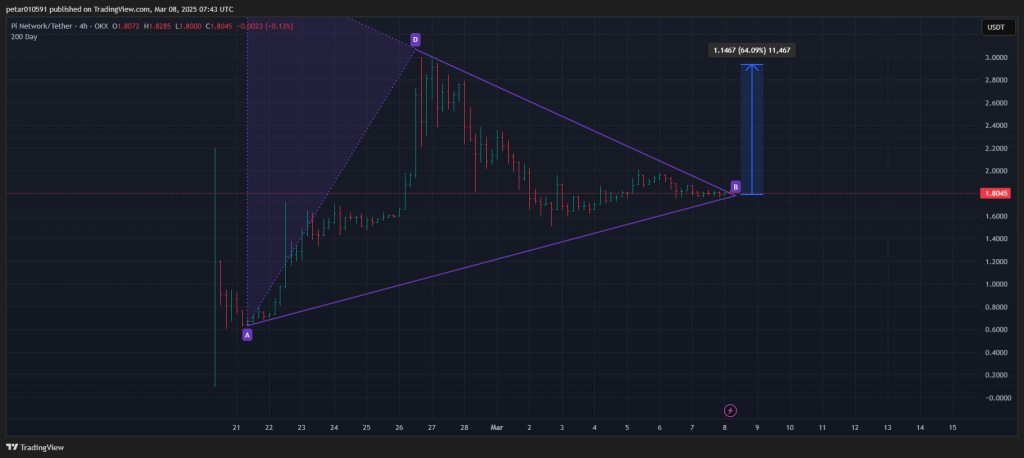
On the other side, the resistance line appears as the upper purple trendline that moves downward from left to right. This is where sellers push the price down, preventing it from rising higher. When Pi Coin reaches this line, it gets rejected and moves downward. The resistance zone currently hovers around $1.90 – $2.00.
Read also: When Will Binance Finally List Pi Coin? Here Are the Hints and Rumors
Pi Coin Price Prediction
As Pi Coin approaches the apex of this triangle formation, traders are watching for a potential breakout. If the Pi Coin price breaks above the upper trendline, it could lead to a significant rally of approximately 64%, potentially reaching the $3.00 mark as indicated by the vertical blue projection on the chart.
Conversely, if the price breaks below the lower trendline, it could drop toward previous support levels, likely around $1.50 or lower.
The current Relative Strength Index (RSI) sits at 46, which is essentially neutral territory. This means there is no strong buying or selling pressure at the moment. The RSI is neither in the overbought zone (above 70) nor in the oversold zone (below 30), suggesting that a breakout could still have room to run in either direction.
For confirmation of a bullish move, traders would want to see the price break above the triangle while the RSI moves above the 50-55 level, which would signal increasing bullish momentum.
The key levels to watch are the support at $1.80 and resistance near $2.00-$2.20. Whether Pi Coin breaks up or down from this pattern will likely determine its next major move.
Follow us on X (Twitter), CoinMarketCap and Binance Square for more daily crypto updates.
Get all our future calls by joining our FREE Telegram group.

We recommend eToro
Active user community and social features like news feeds, chats for specific coins available for trading.
Wide range of assets: cryptocurrencies alongside other investment products such as stocks and ETFs.
Copy trading: allows users to copy the trades of leading traders, for free.
User-friendly: eToro’s web-based platform and mobile app are user-friendly and easy to navigate.

