Polygon (POL) is getting a lot more attention in the crypto community after breaking out of a long downtrend. Technical signals are now hinting at a possible move upward, and with Bitcoin stuck in a tight range, traders are shifting their focus to altcoins like POL for potential action in the short term.
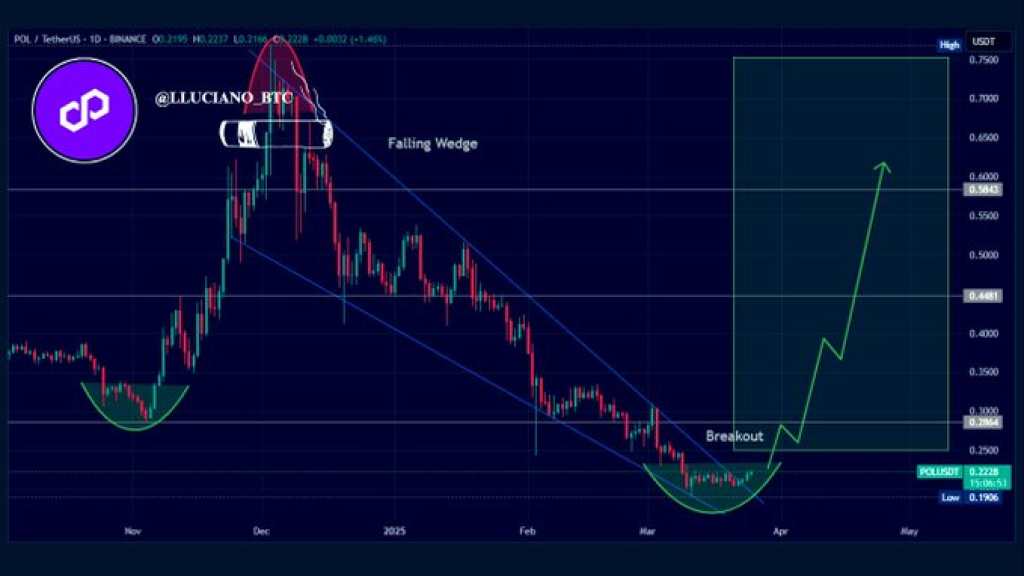
Crypto analyst Lucky, who has a following of over 2 million on X, posted a chart showing POL’s current setup. In the tweet, he pointed out that the token is sitting in an accumulation zone and has just broken out of a falling wedge, a pattern often seen before a bullish reversal. Based on this setup, he believes Polygon’s price could climb up to 3x its current price by May.
Polygon Price Breakout Follows Prolonged Correction
The POL daily chart shows the token peaked around $0.75 in December 2024. After reaching its peak, the price began a steady decline, creating a falling wedge pattern that continued through mid-March 2025. POL price dropped gradually and ultimately found stability between $0.20 and $0.25.
Technical indicators show a clear breakout above the wedge’s resistance line, which typically suggests a potential trend reversal. Analysts often view this setup as a foundation for a new upward phase. The breakout was accompanied by the formation of a rounding bottom, a price structure that generally precedes bullish momentum.
Read Also: Here’s Why Cronos (CRO) Price Is Pumping While Berachain (BERA) Price Gears Up for a Massive Breakout
POL Key Price Zones Identified
Following the breakout, several price levels are being watched closely. Immediate resistance sits around the $0.30 to $0.35 range. If the token sustains its upward trajectory, the next key zone lies between $0.48 and $0.50. The previous high of $0.75 remains a longer-term target, pending confirmation of continued bullish momentum.
The accumulation zone around $0.22 to $0.26 is considered a key support region. This area shows price stability and potential accumulation activity, which often precedes upward breakouts in technical trading setups.
Read Also: These Key Metrics Will Determine Pi Coin’s Success as Community Questions Network’s Direction
Polygon Technical Structure Supports Upside Bias
The falling wedge on the chart is characterized by two converging downward-sloping lines that indicate decreasing market volatility. Within this pattern, Polygon’s price consistently moved lower, forming a series of progressively lower peaks and troughs. This price behavior ultimately culminated in a breakout around mid-March.
Although volume data is not displayed, falling wedge breakouts typically occur with a rise in trading activity. This would align with bullish setups that often follow these formations. The analyst emphasized the “attractive risk/reward” presented at current levels, supported by the rounded bottom structure and the breakout confirmation.
The tweet by Lucky has contributed to rising interest in POL’s technical setup. With the broader market remaining uncertain, altcoins showing structural reversal patterns are gaining more attention from traders. The chart, combined with the public analysis, has positioned POL’s price as a potential candidate for upside continuation through the coming weeks.
As the price remains near the post-breakout zone, traders and analysts continue to observe POL for validation of a sustained move toward higher resistance levels.
Follow us on X (Twitter), CoinMarketCap and Binance Square for more daily crypto updates.
Get all our future calls by joining our FREE Telegram group.

We recommend eToro
Active user community and social features like news feeds, chats for specific coins available for trading.
Wide range of assets: cryptocurrencies alongside other investment products such as stocks and ETFs.
Copy trading: allows users to copy the trades of leading traders, for free.
User-friendly: eToro’s web-based platform and mobile app are user-friendly and easy to navigate.