Shiba Inu price prediction: mapping out potential SHIB scenarios
Shiba Inu price has moved sideways in the past few days after falling to a crucial support level. It was trading at $0.00001240, a few points above the year-to-date low of $0.00001080. This means that it remains sharply lower than last year’s high of $0.00004560. This article explores the potential scenarios for the coin.
Shiba Inu price daily chart analysis
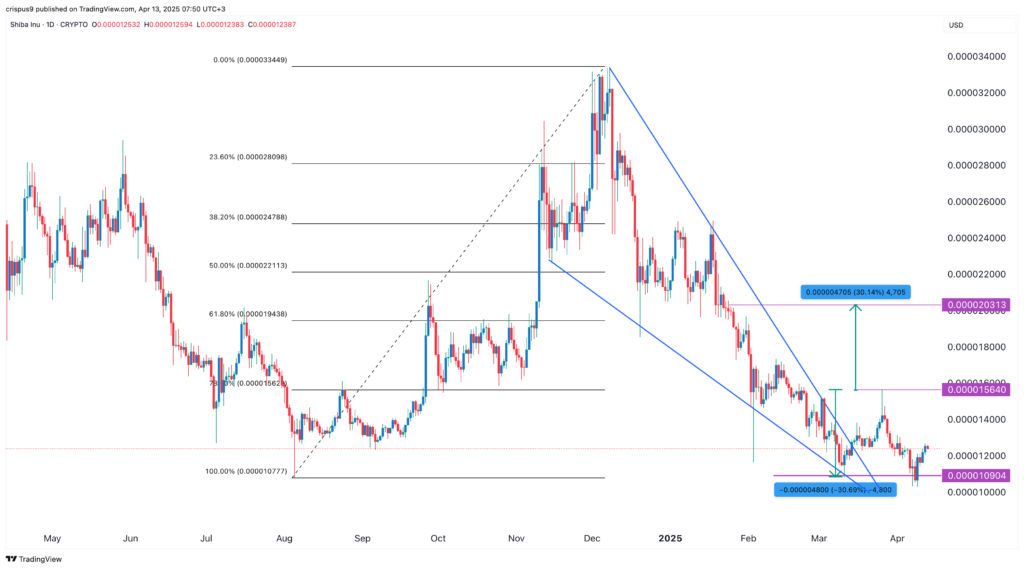
The daily chart points to an eventual SHIB price breakout in the coming weeks. That’s because the coin has formed a double-bottom pattern at $0.00001090, and whose neckline is at $0.00001565.
A double-bottom is one of the most bullsh chart patterns. If this one works out well, there is a likelihood that it will bounce back, eventually to the neckline at $0.00001565, which is up by 25% from the current level. It will then rise to $0.00002030. This target is estimated by first measuring the depth of the double-bottom pattern, and then the same distance from the neckline.
Shiba Inu price has also formed a giant falling wedge pattern, which is shown in blue below. This pattern comprises of two descending and converging trendlines. Historically, the pattern usually leads to a strong bullish breakout when the two lines near their convergence. Therefore, this pattern also points to a strong bullish breakout in the next few weeks.

Read more: Sei price prediction: is it safe to buy the dip amid its DeFi growth?
SHIB price weekly chart analysis
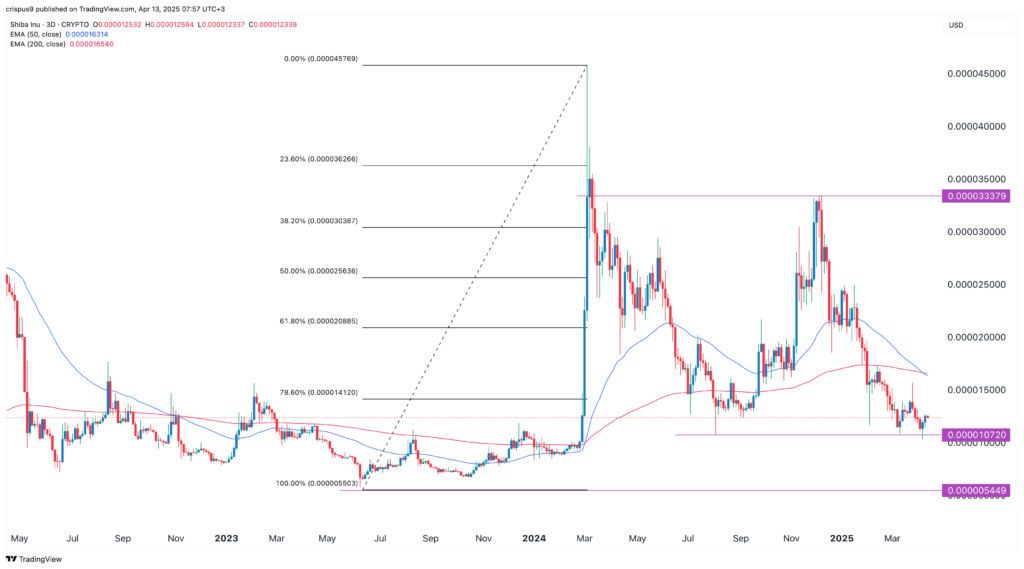
The daily chart paints an optimistic outlook of the SHIB price. However, the 3D chart points to a strong bearish breakdown in the coming weeks, especially if it loses the key support at $0.000010.
The bearish outlook is mostly because the SHIB price has formed a double-top chart pattern at $0.0000333. This is a crucial pattern made up of two peaks and a neckline. In this case, the pattern’s neckline is at $0.000010, where it trades at today.
Shiba Inu price has also collapsed below the 50-week day and 200-day moving averages, forming a death cross. Historically, this death cross is one of the most popular bearish signs in technical analysis. The last time that SHIB formed the death cross was in November 2022, and it plunged by almost 40% afterwards.
Therefore, the 3D chart points to further downside in the coming days. This view will be confirmed if the coin crashes below the support at $0.0000107. Such a move will point to more downside, potentially to the key support at $0.0000054, its lowest level in May 2023.

SHIB chart by TradingView
Potential catalysts for Shiba Inu coin
The daily and the 3D charts are sending mixed signals on the next Shiba Inu price outlook. Therefore, the next path could mainly be influenced by its fundamentals.
There are signs that the crypto market will bounce back as investors embrace the new normal of high tariffs and recession. That’s because, despite all the challenges in the financial market, Bitcoin has remained above $80,000, a sign that bulls are providing it with a backstop.
Further, the rising recession odds mean that the Federal Reserve will likely intervene in the market, especially now that inflation is falling. Analysts believe that the Fed may deliver more interest rate cuts than expected in the coming meetings.
The crypto market often does well when the Fed has embraced easy money policies. Therefore, fundamentally, there is a likelihood that the first scenario of the daily chart will prevail.
Read more: Top cryptocurrencies to watch: Sonic, XRP, Cardano, Solana
The post Shiba Inu price prediction: mapping out potential SHIB scenarios appeared first on Invezz