Yesterday, the price of Solana, ETH, and XRP fell. It is just a small general correction of the crypto markets, likely due in particular to Bitcoin.
In fact, in recent weeks the price of BTC had risen too much, and after several days of excessive enthusiasm, this finally began to dissipate yesterday. The consequence was a correction of Bitcoin that then dragged the entire crypto market down, even though in the end BTC is the one that loses the least among the top 10.
The correction of Solana: ETH and XRP follow as well
For quite some time now, the price of Solana is one of those that reacts most quickly to the volatility of Bitcoin.
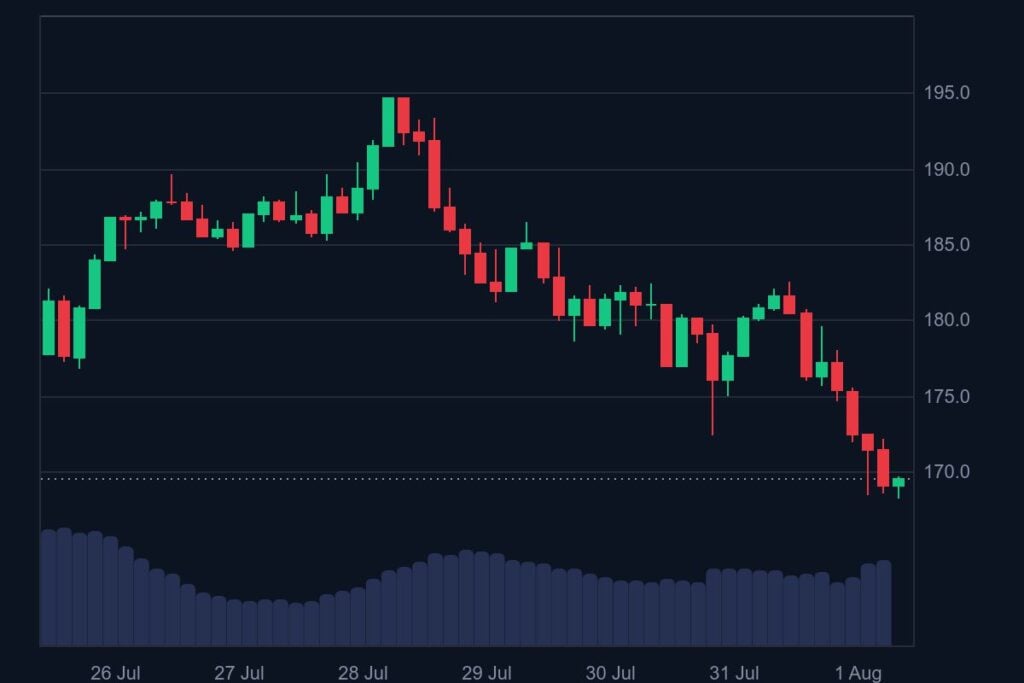
SOL, the native crypto of Solana, is losing 7% in the last 24 hours, and 5% in the last seven days. However, it remains 12% above the values of thirty days ago.
What might apparently surprise is that during this very recent bullrun, the price of SOL didn’t even manage to approach the all-time highs from the beginning of the year, but those were only possible thanks to a powerful push from the memecoin market, which is currently relatively stagnant.
It is necessary, however, to also highlight that already in June there was a first correction, starting from about $180 and ending at about $130, followed by a small and quick bullrun that by mid-July had brought it back above $200.
Note that the current price is very close to that of twelve months ago, and also to that of October 2024, before the Trump-trade brought it to new all-time highs.
The situation therefore does not seem excellent at all, but for now it does not even seem worrying. On the other hand, the Trump-trade generated a true speculative bubble in the price of Solana, which then completely deflated between February and April. Therefore, it would be advisable to ignore it in the analysis of the price trend in the medium/long term, and by ignoring it, the situation actually appears quite normal.
The correction currently underway could also continue if that of Bitcoin continues as well.
The decline of Ethereum (ETH) and the differences with Solana (SOL) and XRP
A similar discussion also applies to Ethereum, although in the medium/long term it is a bit different.
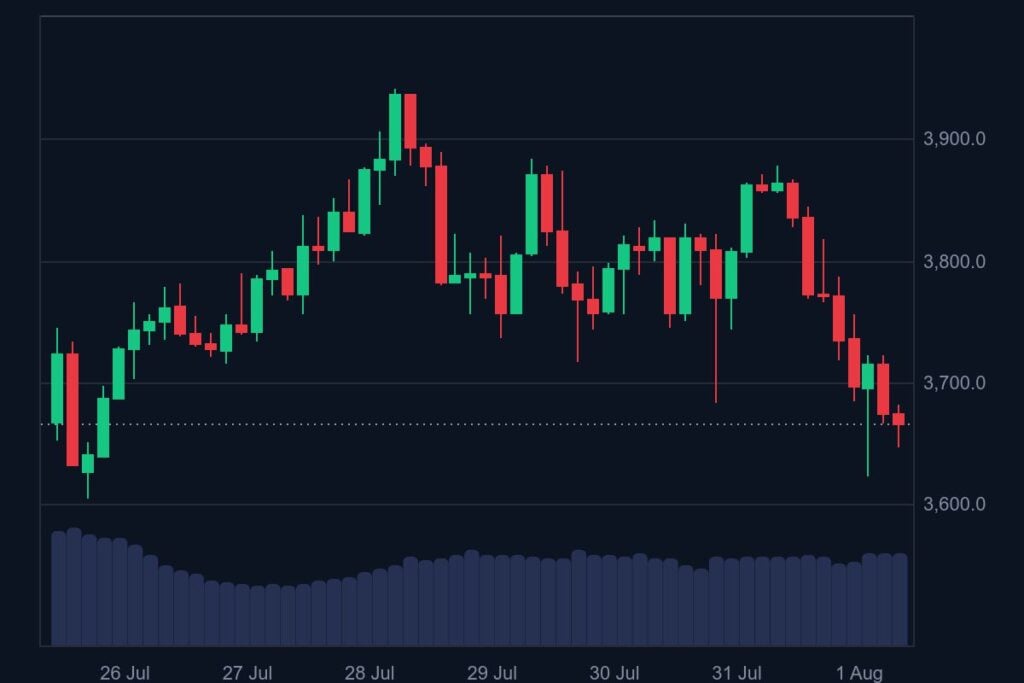
In the short term, the trend of the price of ETH differs from that of SOL mainly because compared to seven days ago the price of Ethereum is not losing anything.
However, the fact remains that it has not yet managed to update the all-time highs of 2021.
The current price level of ETH, even after yesterday’s correction, still turns out to be quite high compared to the highs of late 2024, because for now it remains well above $3,600, after surpassing $4,000 in December and plummeting below $1,500 in April.
Furthermore, in June it did not undergo a true correction, but only a brief pause during the upward path that began in May.
In other words, currently Ethereum seems to be more solid compared to Slana, probably precisely because the price of SOL is still heavily influenced by the volatile memecoin market, while that of ETH has definitively surpassed the strong retracement of the first months of 2025.
As for Ethereum, it is advisable to consistently monitor the trend of its price in Bitcoin, because in the medium/long term, this actually seems to be one of the main drivers.
After dropping in April to the lowest levels since 2020, that is below 0.019 BTC, in July it managed to climb back above 0.032 BTC, a level significantly higher than that of April but still decidedly low. It is enough to remember that during the great bullrun of 2021 it managed to reach up to 0.085 BTC, only to begin a long and deep retracement in the early months of 2023, which ended precisely in April of this year.
Yesterday’s correction brought it back only to 0.0317 BTC, that is, just below the maximum levels of July.
“`html
The resilience of XRP
“`
Although the prezzo di XRP is also correcting today, in reality, in the medium term, it is holding up great.
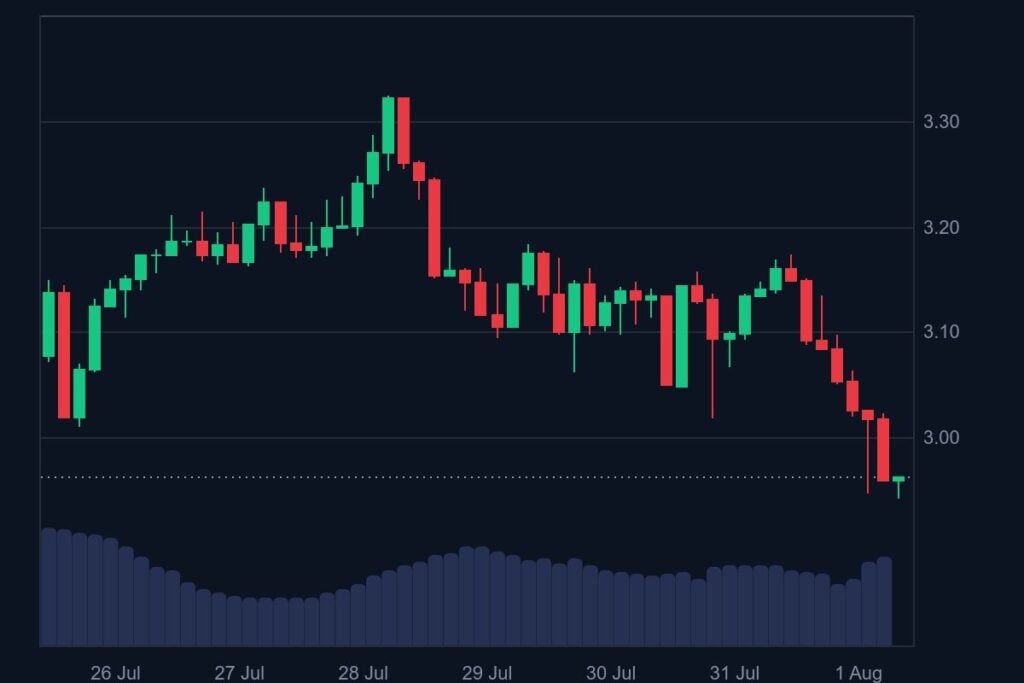
Before the Trump-trade at the end of 2024, it was around $0.5, while now it has just fallen below $3.
Already in December it had risen to $2.7, then reaching $3.3 in January.
Since then, it has started a long phase of volatile lateralization, still ongoing, which has not brought it below $2 again except for a very brief small episode in April.
Note that in the chorus of previous years, from 2018 to 2023, net of the great speculative bubble of 2021, it almost always fluctuated between $0.2 and $0.7, with rare exceptions.
So what is surprising is not so much the impetuous growth at the end of 2024, but above all the great resilience of 2025 at levels ten times higher than those of previous years.
However, this exceptional situation is only valid in the medium term, because in the short term the price trend of XRP is moving exactly like that of all the other major criptovalute.
It could therefore simply be that the great phase of intense suffering that lasted for years, mainly due to the SEC case, has ended, and a new phase has begun that is gradually returning to normal, but at a much higher price level.