Pi Coin price is still stuck in a sluggish downtrend, and not much has changed in terms of momentum.
The price is hovering just above $0.44, and holds onto support, but there’s still no sign of real strength from buyers. Most technical indicators are still flashing “sell,” and the short-term trend hasn’t flipped.
After failing to stay above $0.50, the token has slipped into a quiet range, and without any fresh news or volume spikes, the sideways grind continues.
Let’s break down what’s happening.
📊 Pi Coin Daily Overview (July 19)
- Current Price: $0.4482
- 24H Change: +1.72%
- RSI (14): 37.41
- Volume: Still light
Pi Coin price is trading in a tight band between $0.44 and $0.46. Sellers are still in control, and the price remains stuck under a trendline that’s been pressing it down since May. Until that changes, the market is likely to keep drifting.
🔍 What the Pi Coin Chart Is Saying
The Pi daily chart still shows a strong downtrend. Since failing to break above $1.75 in May, the price has made lower highs and faded slowly.
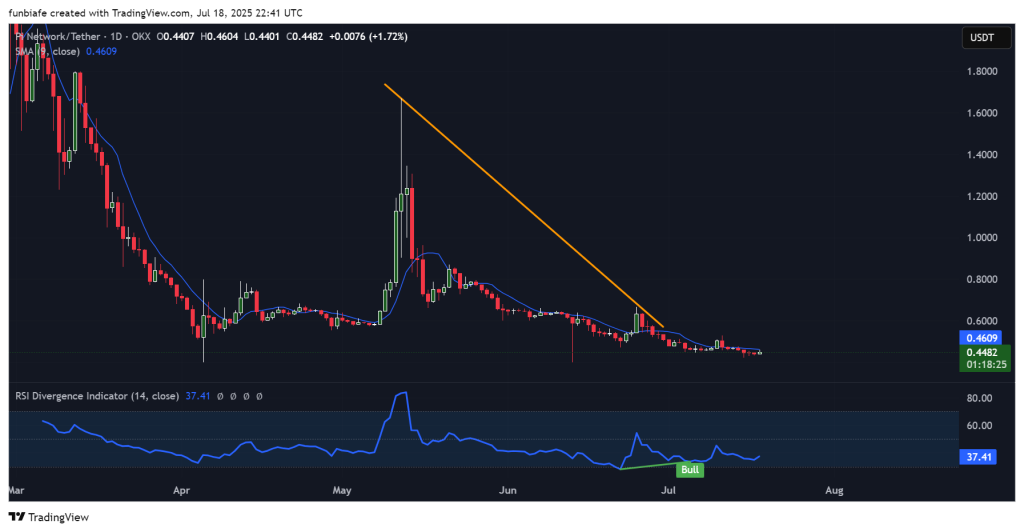
There’s a potential bullish RSI divergence, where the RSI is climbing while Pi Coin price makes lower lows, but it hasn’t led to anything meaningful yet.
Pi needs to break above the $0.48–$0.50 range to shake off this bearish pattern. If it loses $0.44, it could fall toward $0.40 next.
📈 Key Technical Indicators (Daily Timeframe)
| Indicator | Value | What It Tells Us |
| RSI (14) | 37.3 | Weak momentum, heading toward oversold |
| MACD (12,26) | -0.029 | Bearish momentum still in play |
| CCI (14) | -94.91 | Deep in bearish territory |
| Ultimate Oscillator | 45.27 | Light selling pressure across all timeframes |
| ROC | -4.451 | Price losing ground |
| Bull/Bear Power (13) | -0.0313 | Bears still running the show |
Summary: All these indicators point in the same direction, the market still leans bearish, and momentum hasn’t flipped yet.
🔮 What Could Happen Next
Bullish Scenario:
A breakout above $0.50 with strong volume could send Pi toward $0.54. But right now, there’s no real momentum for that move.
Neutral Scenario:
We might see more sideways action between $0.44 and $0.46 while the market waits for a reason to move.
Read Also: Is Pi Coin Really a Scam? Here’s What One Top Analyst Thinks
Bearish Scenario:
A close below $0.44 could drag Pi coin down to the $0.40 zone, which last held as support earlier this month.
🧠 Bottom Line
Pi Coin price is still under pressure, trading below key resistance and showing no strong bullish signs. The $0.44 level is holding for now, but unless volume picks up or a breakout happens, sideways or downward action seems more likely in the short term.
Keep an eye on that $0.44 support, it’s the level that could set the tone for what comes next.
Subscribe to our YouTube channel for daily crypto updates, market insights, and expert analysis.