Stellar (XLM) has surged more than 10% in the last 24 hours, attempting to recover from a 15% correction over the past month. Despite this rebound, XLM’s trend remains at an important point, with its market cap now standing at $8.6 billion.
Technical indicators show that buying pressure has increased significantly, with DMI and CMF both pointing to growing accumulation. However, XLM still faces key resistance levels, and whether it can sustain this momentum will determine if the price can break above $0.35 or if further consolidation is ahead.
XLM Chart Shows Buyers Are Now In Control
Stellar’s DMI chart shows that its Average Directional Index (ADX) has dropped to 28.7, down from 35.6 two days ago. ADX is a key indicator that measures the strength of a trend, regardless of direction, with values above 25 typically signaling a strong trend and values below 20 suggesting a weak or consolidating market.
A declining ADX, even while the price moves in a certain direction, indicates that the strength of the trend is fading.
In this case, the drop from 35.6 to 28.7 suggests that Stellar’s bearish trend is weakening, creating an opportunity for a possible shift in momentum.
Looking at the Directional Indicators, +DI has surged to 31.2 from 8, while -DI has dropped to 16.4 from 30.7. This major shift in buying and selling pressure suggests that bulls have regained control after a period of strong selling.
Since Stellar is attempting to transition from a downtrend into an uptrend, this increase in +DI is a positive signal. However, for the new trend to gain strength, ADX would need to stabilize and turn upward, confirming growing momentum.
If ADX continues declining, XLM could consolidate before making a decisive move, but if it rises alongside +DI, it will reinforce a stronger breakout to the upside.
XLM CMF Has Surged Since March 10
Stellar’s Chaikin Money Flow (CMF) indicator has risen to 0.13, recovering from -0.14 just three days ago, after briefly peaking at 0.18 a few hours ago. CMF measures buying and selling pressure by analyzing both price movement and volume on a scale from -1 to 1.
A positive CMF value suggests that buying pressure is dominant, while a negative reading indicates stronger selling activity.
Generally, values above 0.05 signal accumulation, whereas values below -0.05 indicate distribution, making CMF a useful tool for assessing whether capital is flowing into or out of an asset.
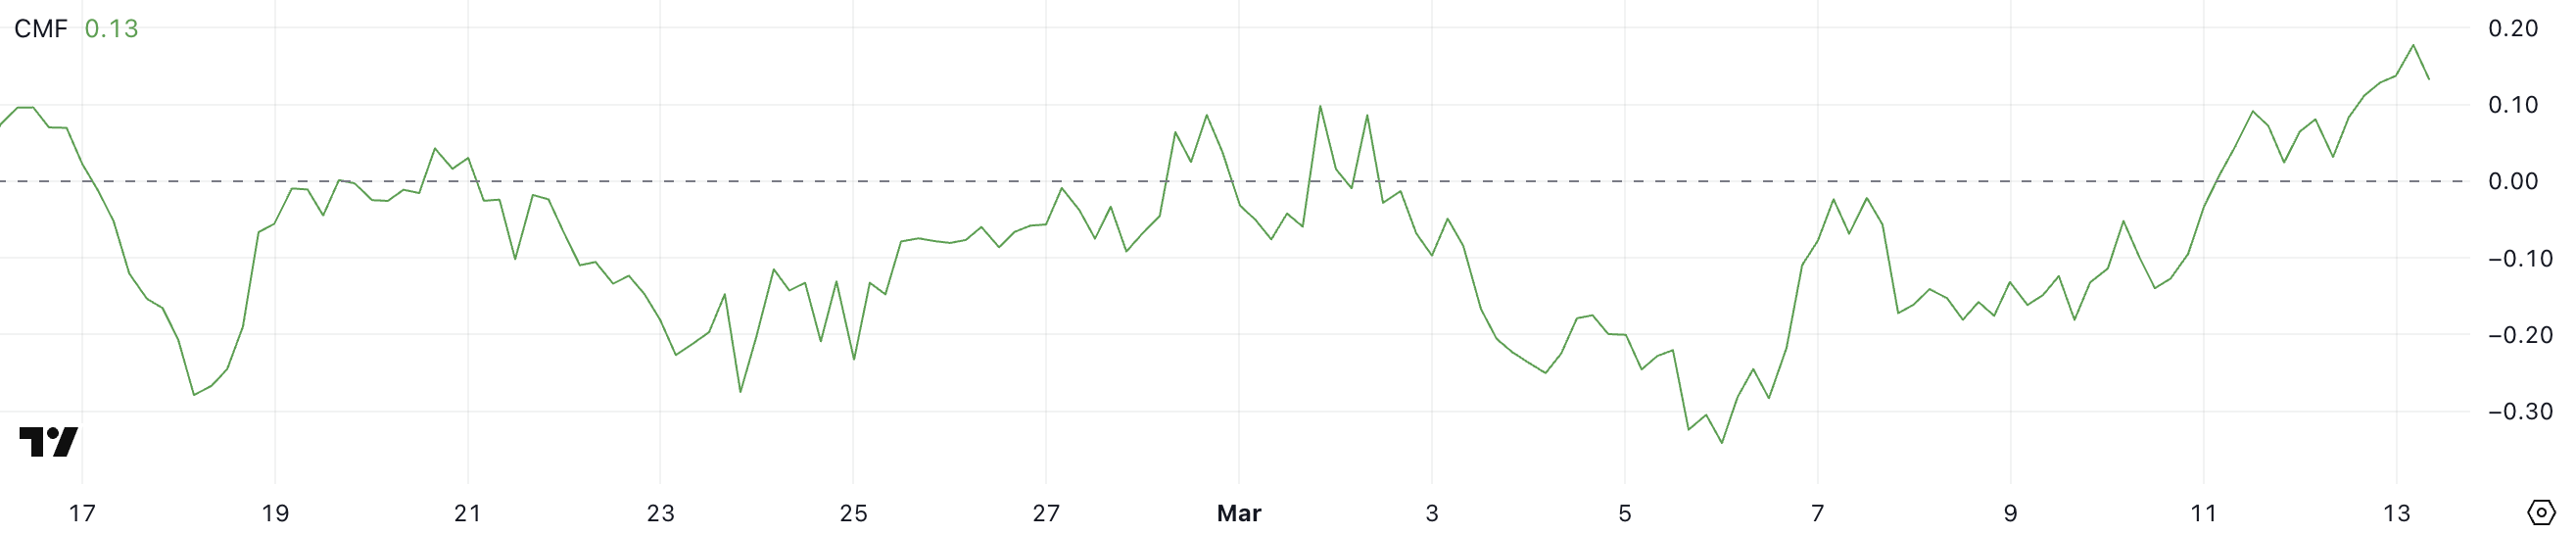
With Stellar’s CMF now at 0.13, buying pressure has clearly strengthened, reversing the prior bearish trend seen when CMF was negative.
This shift suggests that investors have been accumulating XLM over the past few days, supporting its recent price recovery. However, since CMF peaked at 0.18 before slightly declining, some short-term profit-taking may have occurred.
If CMF remains in positive territory and trends higher again, it will reinforce further upside potential, but if it starts dropping back toward negative values, it could signal weakening demand and a possible price pullback.
Will Stellar Surpass $0.35 In March?
Stellar’s EMA lines still indicate a bearish trend, with short-term EMAs positioned below the long-term ones. However, the recent upward movement in short-term EMAs suggests that momentum could be shifting, increasing the chances of a trend reversal.
If buying pressure continues, Stellar’s price could rise to test the resistance at $0.309, a key level that would determine whether the recovery can sustain itself.
A breakout above this resistance could fuel further upside, potentially pushing XLM toward $0.349. A stronger uptrend could lead to a rally toward $0.375.
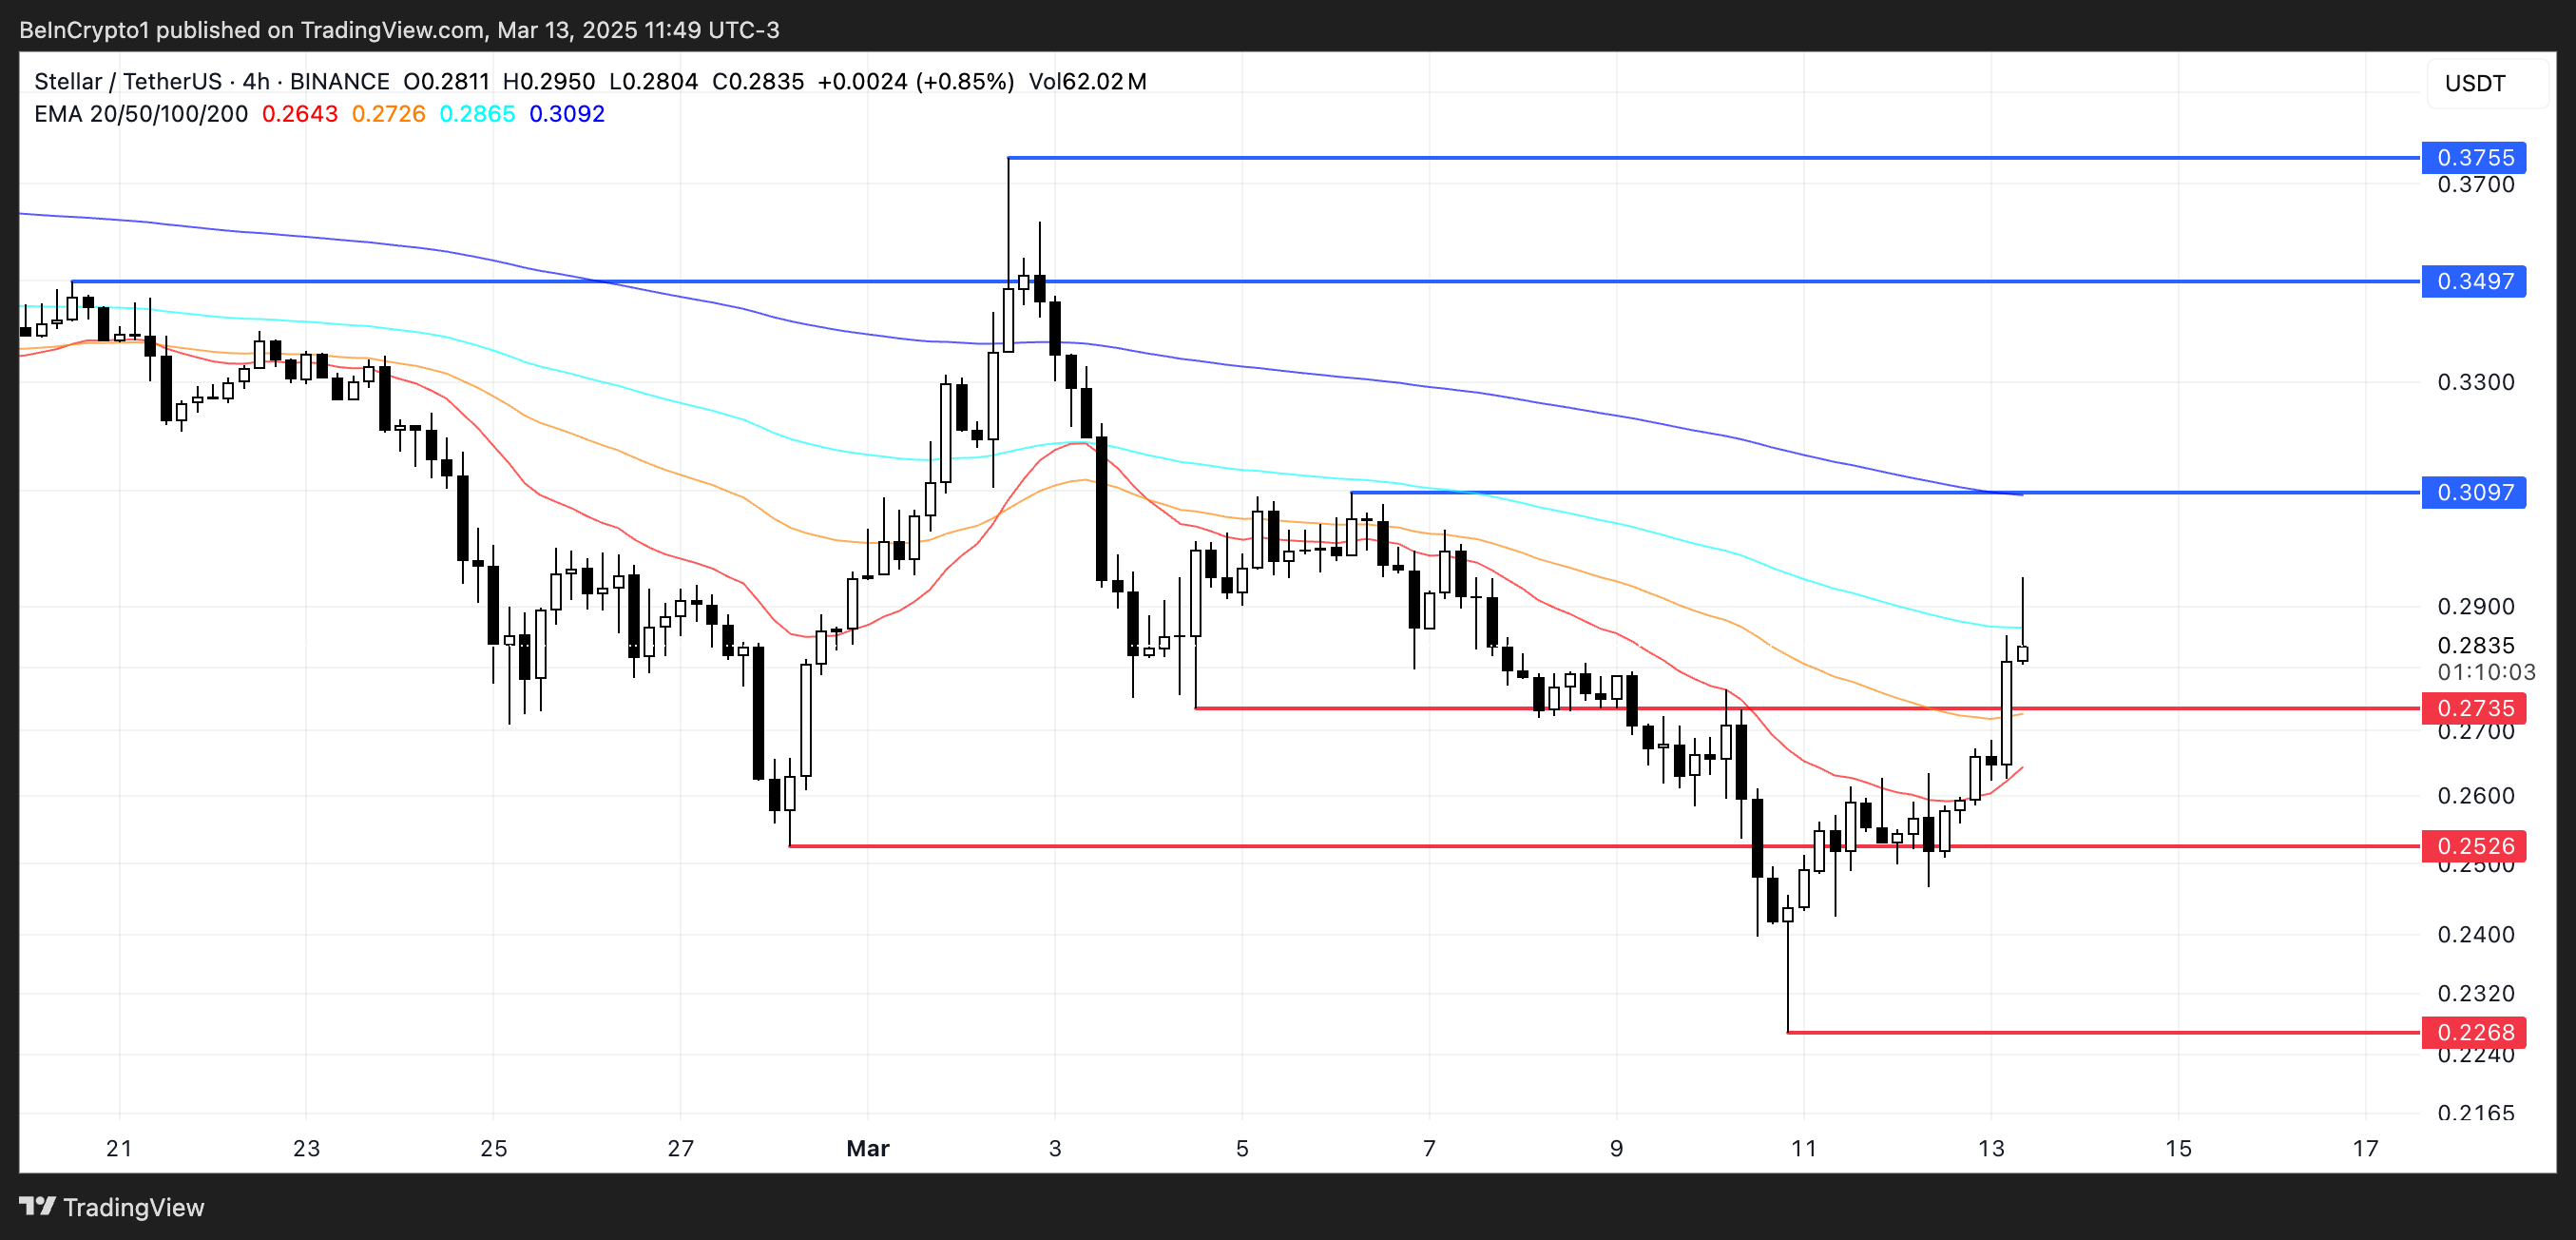
On the downside, if the short-term recovery loses strength and buyers fail to establish an uptrend, Stellar could face renewed selling pressure.
In this scenario, the first key support level to watch would be $0.273, which has acted as a critical zone in previous price action. A breakdown below this level could expose XLM to further losses, with support at $0.252 as the next major level.
If bearish momentum intensifies, the price could decline further, potentially reaching $0.226, marking a deeper correction before any potential reversal.
Disclaimer
In line with the Trust Project guidelines, this price analysis article is for informational purposes only and should not be considered financial or investment advice. BeInCrypto is committed to accurate, unbiased reporting, but market conditions are subject to change without notice. Always conduct your own research and consult with a professional before making any financial decisions. Please note that our Terms and Conditions, Privacy Policy, and Disclaimers have been updated.