The XRP price stayed mostly stable yesterday, hovering around the $2.16-$2.17 zone without any major breakout or breakdown. We predicted yesterday that if XRP cleared $2.22 resistance, it could push toward $2.30-$2.35, but that breakout did not occur.
Let’s take a look at where the XRP price could be heading today.
XRP Chart Analysis
XRP is now trading at $2.1697 as of April 27. Looking at the 4H chart, the price continues to move sideways in a tight consolidation pattern. The rising trendline that has formed since mid-April is still intact and acting as dynamic support, with stronger horizontal support found between $2.00 and $2.05.
The recent price action shows XRP forming higher lows, creating a slow compression between rising support and horizontal resistance at $2.20-$2.22. This setup resembles an ascending triangle, which often precedes a bullish breakout if volume increases.
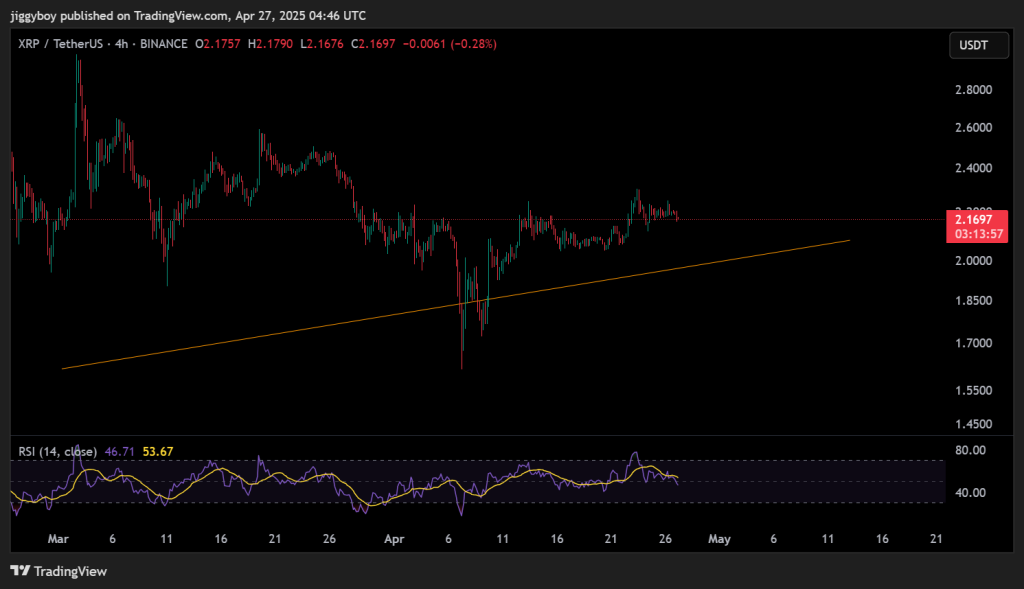
Support for XRP is visible at $2.10, with a stronger base at the $2.00-$2.05 zone. If selling pressure intensifies, major support from earlier this month sits at $1.80-$1.85. On the resistance side, the XRP price faces immediate hurdles at $2.22. If that level is broken, the path toward $2.30 and $2.35 could open.
Volume appears to be declining slightly based on the price movement, which often suggests a larger move is brewing.
Technical Indicators
Technical indicators paint a cautious picture for XRP. The RSI is at 46.71, showing a neutral but slightly bearish market stance. This leaves room for both upward and downward moves.
The MACD reads -0.005, signaling mild bearish momentum without strong downside pressure yet. The Commodity Channel Index (CCI) stands at -135.4883, suggesting strong selling pressure and mild oversold conditions that could potentially lead to a short-term bounce.
| Indicator | Value | Signal Interpretation |
| MACD | -0.005 | Mild bearish crossover zone |
| CCI (Commodity Channel Index) | -135.4883 | Strong selling pressure, oversold conditions |
| Ultimate Oscillator | 37.669 | Bearish momentum present |
| ROC (Rate of Change) | -0.968 | Weak momentum, slight downward pressure |
| Bull/Bear Power | -0.0192 | Slight bearish dominance |
The Ultimate Oscillator sits at 37.669, reinforcing a bearish tilt among traders. The Rate of Change (ROC) is negative at -0.968, showing a slight price decline, and Bull/Bear Power sits at -0.0192, favoring sellers, though not strongly.
XRP Price Forecasts for Today
For April 27, XRP could once again follow two possible paths based on the current technical setup:
In the bullish scenario, if XRP price manages to break through the $2.22 resistance with increasing volume, it could target $2.30 first as an initial resistance zone. With continued buying momentum and broader market support, XRP could revisit the $2.35 level. Under ideal conditions, and if Bitcoin remains stable, a push toward $2.50 could come into view.
In the bearish scenario, if XRP loses the $2.15 support level, the price could fall toward the $2.05 zone. A further breakdown might bring XRP to test the $2.00 area or even the major support level at $1.85 if broader market weakness persists.
Given the ongoing weekend environment with typically lower trading activity, XRP price may continue trading between $2.15 and $2.20 unless a catalyst emerges to trigger a breakout in either direction.
Read Also: Stellar (XLM) Price Breakout Confirmed: Here’s the Next Big Target
Follow us on X (Twitter), CoinMarketCap and Binance Square for more daily crypto updates.
Get all our future calls by joining our FREE Telegram group.

We recommend eToro
Active user community and social features like news feeds, chats for specific coins available for trading.
Wide range of assets: cryptocurrencies alongside other investment products such as stocks and ETFs.
Copy trading: allows users to copy the trades of leading traders, for free.
User-friendly: eToro’s web-based platform and mobile app are user-friendly and easy to navigate.

