
RENDER is making some serious moves right now. After a long period of trading sideways, the price just broke out of a key chart pattern, and it’s catching attention. In the past 24 hours alone, RENDER has jumped 11.55% and is now trading at $3.74. Even more interesting, trading volume has spiked by 65.75%, showing a clear surge in interest from traders and investors.
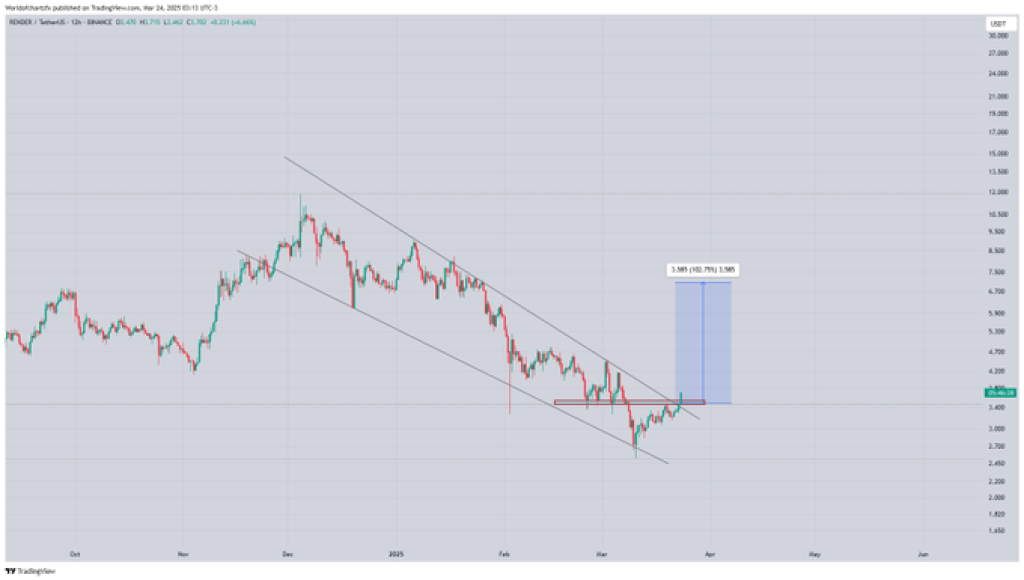
Prominent analyst World Of Charts pointed out the breakout on X (formerly Twitter), suggesting that RENDER price could be gearing up for a strong rally, possibly even a 100% move toward the $7 to $8 range. The chart they shared shows RENDER finally breaking free from a downward channel it had been stuck in for weeks.
For a while, the price was moving inside this descending channel, bouncing between two trendlines. But now, it’s broken above both the upper channel line and a key horizontal resistance around $3.45–$3.50. That’s a big deal from a technical standpoint.
The breakout came with a strong green candle, which is usually a sign that buyers are stepping in with confidence. This kind of price action often marks the end of a downtrend and the start of a new bullish phase, especially when it comes with high volume, which RENDER has right now.
Read Also: This Trader Makes a Shocking 12x Cardano (ADA) Price Prediction
RENDER Key Support and Resistance Areas
The $3.45 to $3.50 zone now serves as a critical support level after being flipped from resistance. This level acted as a base during the recent consolidation and played a central role in the breakout confirmation. If the price of RENDER continues to stay above this level, it could attract further buying pressure.
Looking ahead, chart projections place the next major resistance between $7 and $8, based on prior highs and the calculated target from the breakout structure. This corresponds with the area identified in the tweet by World Of Charts, aligning technical expectations with historical price behavior.
RENDER Price Target and Measured Move
The price structure on the chart suggests a measured move toward the $7.10 area. This target is derived from the size of the consolidation zone and reflects a potential 100% rally from the breakout point. The breakout occurred after a tight range formed between $3 and $3.5, creating the base for this move.
This type of measured breakout is often used by traders to estimate future price potential. The clean break and volume spike support this projection, assuming the asset maintains momentum and avoids falling below the $3.5 support.
Read Also: Onyxcoin Price Prediction: Crypto YouTuber Predicts Massive 10x Surge for XCN
RENDER Market Sentiment and Volume Spike
Render’s current 11.55% daily gain is backed by a surge in trading volume, now up by 65.75%. This increase in activity may suggest renewed interest amongst retail and institutional participants. The tweet by World Of Charts, which states, “$Render #Render Breaking Consolidation, Expecting Solid Bullish Wave Towards 7-8$ After Successful Breakout,” reflects current sentiment circulating on social media.
While confirmation through sustained price action is still required, current technical signals and market activity indicate that Render’s price could be preparing for a strong move, should the breakout hold.
Follow us on X (Twitter), CoinMarketCap and Binance Square for more daily crypto updates.
Get all our future calls by joining our FREE Telegram group.

We recommend eToro
Active user community and social features like news feeds, chats for specific coins available for trading.
Wide range of assets: cryptocurrencies alongside other investment products such as stocks and ETFs.
Copy trading: allows users to copy the trades of leading traders, for free.
User-friendly: eToro’s web-based platform and mobile app are user-friendly and easy to navigate.


