AAVE price is hovering around $278 after bouncing off its June lows, but things are starting to tighten up. Both the daily and 4-hour charts show that the token is moving in a well-defined range.
On one hand, it held above key support zones. On the other hand, it’s struggling to break through some tough resistance levels.
With no major news or tweets stirring the pot, traders are closely watching the charts to see which side moves first.
AAVE Daily Chart Signals a Potential Shift – But Resistance Still Holds
Looking at the bigger picture, AAVE had a huge rally back in late 2024, it climbed close to $440 before entering a long downtrend.
That downtrend was finally broken around $240 earlier this year, a key break of structure that hinted the tide might be turning.
Since then, AAVE price has been bouncing between $240 and $310. There was another breakout attempt near $310, but it got rejected.
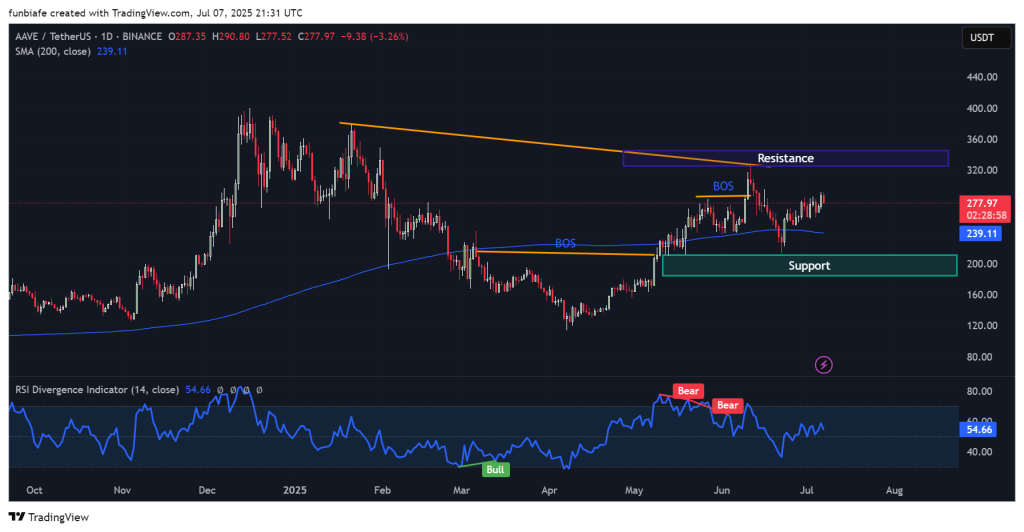
That level has now become a resistance zone. Meanwhile, the RSI is sitting at 54.66, and it’s showing no clear direction not overbought, not oversold.
Earlier bearish signals on the RSI led to pullbacks, while a bullish divergence back in March sparked the latest push higher.
AAVE Price Analysis: Support and Resistance Are Defining the Range
The current resistance zone between $310 and $330 is still the level to beat. There’s also a longer-term trendline coming down from past highs that intersects this range, even adding more pressure.
If AAVE price can push through with volume, it might aim for $360 next. On the flip side, support is sitting between $200 and $220, and the 200-day SMA around $239 adds more strength to that level. If the price drops below that area, a move back toward $200 could follow.
AAVE 4-Hour Chart: Short-Term Trend Still Intact
Zooming into the 4-hour chart, things still look relatively strong in the short term. AAVE is forming higher lows, and the price is sitting above the 200-period SMA, currently at $267.06.
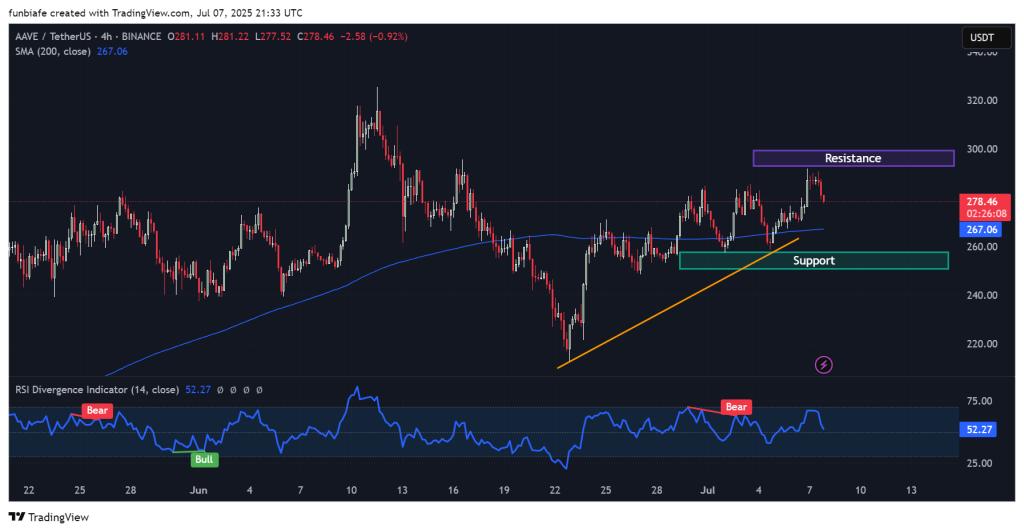
There’s a solid support zone between $255 and $265 that’s been tested a few times and held up. AAVE price made a run at the $295–$300 resistance area but pulled back after getting rejected.
RSI is at 52.27, it shows neutral momentum. A bearish divergence showed up around July 6–7, which may explain the latest pullback. But as long as the price stays above $265, bulls are still in the game.
Read Also: 10 Must-Follow Crypto Analysts on X (Twitter)
What Comes Next?
Right now, AAVE price is caught in a battle between support and resistance. If it can hold $265 and get some momentum, another shot at the $310 area seems likely.
But if that support breaks, the market may shift its focus back to the $240 zone, and possibly even lower. For now, traders are watching and waiting.
Subscribe to our YouTube channel for daily crypto updates, market insights, and expert analysis.

