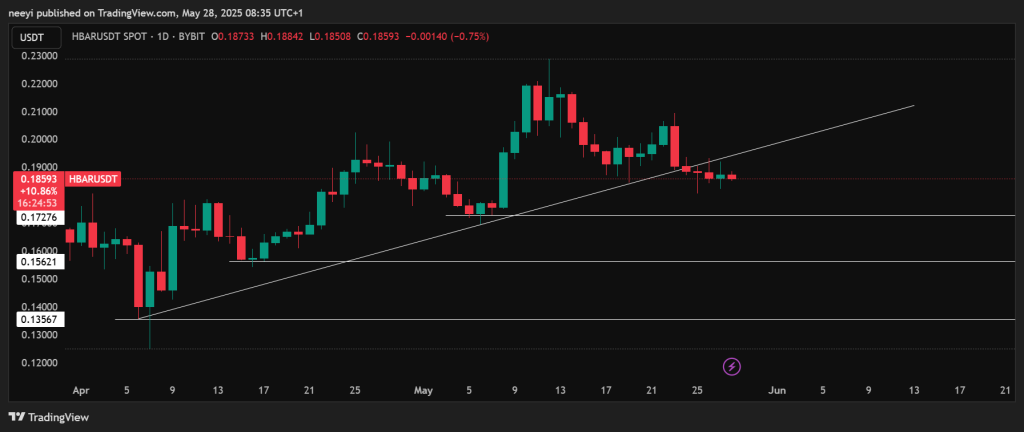
After following an ascending trendline for several weeks since April, Hedera (HBAR) price broke below that support between May 24 and May 27. This shift has tilted the short-term outlook from bullish to bearish, at least for now. At the time of writing, HBAR is trading around $0.185.
If the downward trend continues, we might see the HBAR price slide to $0.172, or possibly test deeper levels like $0.15 or even $0.13. However, if the price manages to reclaim the lost trendline as support, especially with help from positive market sentiment or new Hedera developments, a bullish reversal could be on the table in June.
Let’s now explore what some of the technical indicators are saying, based on daily chart data from Investing.com.
Hedera Weekly Chart Indicator Readings
| Indicator Name | Value | Interpretation |
|---|---|---|
| Relative Strength Index (RSI 14) | 47.114 | Neutral trend |
| Stochastic Oscillator (STOCH 9,6) | 21.524 | Selling pressure |
| Moving Average Convergence Divergence (MACD 12,26) | 0.02 | Slight bullish signal |
| Average True Range (ATR 14) | 0.1025 | Low volatility |
| Highs/Lows (14) | -0.0214 | Bearish movement |
| Ultimate Oscillator | 42.852 | Bearish sentiment |
These readings offer a mixed picture. The RSI suggests the market is not clearly trending up or down, while the MACD leans slightly bullish. However, both the Stochastic and Ultimate Oscillator show selling pressure, hinting that short-term sentiment is cautious or bearish. The ATR indicates the market is experiencing low volatility, which may precede a breakout in either direction.
What the Moving Averages Say About HBAR Price
What the Moving Averages Say About HBAR Price
The moving averages now give a much more bearish picture for Hedera (HBAR). Both the Simple Moving Averages (SMA) and the Exponential Moving Averages (EMA) for the 50, 100, and 200-day timeframes are flashing sell signals.
- The MA50 is around $0.1877 (SMA) and $0.1876 (EMA), and HBAR is currently trading below both levels.
- The MA100 is at $0.1879 (SMA) and $0.1891 (EMA), again with the price falling beneath them.
- The MA200 readings of $0.1930 (SMA) and $0.1921 (EMA) are well above the current price, showing that HBAR has broken under key long-term support.
This indicates that from both short-term and long-term technical perspectives, HBAR is currently in a downtrend. Unless a strong reversal or major catalyst appears, the moving average signals suggest more downside pressure ahead.
What Could Move HBAR Price in June?
Beyond technicals, real-world fundamentals are just as important for predicting Hedera price movements.
1. Enterprise Adoption and Partnerships
HBAR saw a rise in utility during April 2025, with enterprise activity up over 60%. This includes partnerships with IBM and Standard Bank, pushing adoption for real-world use cases like cross-border payments and supply chains. More adoption in June could push the price back up.
2. Ecosystem Growth
The network has processed over 20 billion transactions in 2025. The rise of DeFi and tokenization on Hedera has supported its visibility and use. A continued surge in this area could keep HBAR relevant and in demand.
3. Council Governance and Announcements
The Hedera Governing Council remains a unique strength. Announcements related to its 39-member council or new integrations have historically created excitement. If June includes any major roadmap reveal or council update, this could spark a rally.
4. General Altcoin Market Strength
HBAR tends to benefit when altcoins in general are performing well. If Bitcoin and Ethereum stay bullish in June, capital could flow back into promising altcoins like HBAR.
5. Profit-Taking
Following May’s rallies, some investors may take profits. This could temporarily push prices down or lead to sideways action unless offset by new bullish events.
6. Events and Developer Activity
Hedera’s presence at major events such as Vietnam Blockchain & AI Week helps with exposure and community growth. Active participation can lead to new developer interest, which supports long-term token value.
June Forecast: Bearish, Neutral, and Bullish Scenarios
We asked ChatGPT for HBAR price prediction for June and it gave us the following scenarios.
Bearish Prediction: $0.13 – $0.15
If HBAR continues falling without any major positive news and broader market weakness persists, the price could drop toward $0.15 or even $0.13. This is especially possible if investor confidence declines or key support levels fail.
Factors that could lead to this:
- General market downturn
- Lack of new adoption news
- Break of $0.172 support
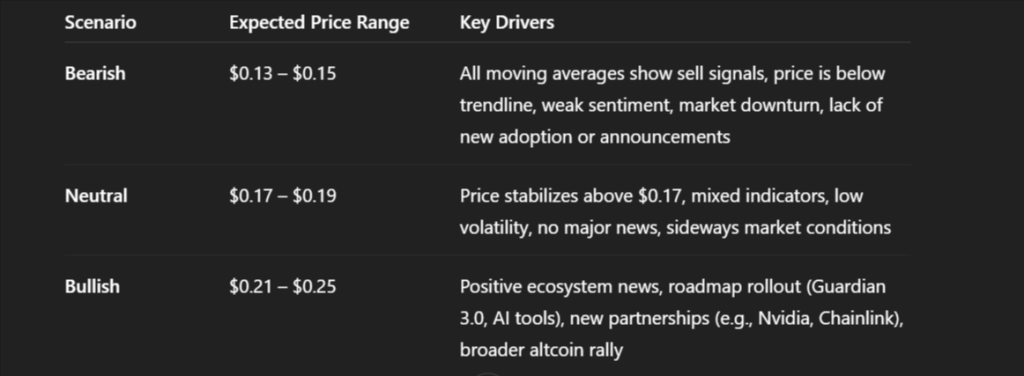
Neutral Prediction: $0.17 – $0.19
If HBAR stabilizes but fails to regain strong momentum, the token may trade sideways around its current levels. This would reflect a cautious market waiting for clearer signals.
Factors that could lead to this:
- Mixed ecosystem news
- Sideways trading across altcoins
- Uncertainty around roadmap execution
Read Also: Kaspa (KAS) vs. SUI: Which Is the Better Crypto to Hold Right Now?
Bullish Prediction: $0.21 – $0.25
If Hedera regains its trendline, continues building momentum, and the market turns optimistic again, we could see a healthy rally in June. A return to $0.25 is possible if large partnerships or major product launches are announced.
Factors that could lead to this:
- New partnerships (e.g. Nvidia or Chainlink integrations)
- DeFi expansion and new tokenized asset launches
- Strong Bitcoin or Ethereum price movements
Follow us on X (Twitter), CoinMarketCap and Binance Square for more daily crypto updates.
Read our recent crypto market updates, news, and technical analysis here.

We recommend eToro
Active user community and social features like news feeds, chats for specific coins available for trading.
Wide range of assets: cryptocurrencies alongside other investment products such as stocks and ETFs.
Copy trading: allows users to copy the trades of leading traders, for free.
User-friendly: eToro’s web-based platform and mobile app are user-friendly and easy to navigate.