
Although XRP has gained some ground in the last 24 hours in a bid to breach the $3 resistance, the asset’s technical structure is painting a concerning picture for the short term.
According to analysis by Ali Martinez, the TD Sequential recently flashed a sell signal on the three-day chart, prompting a notable price pullback below the $3 mark, he noted in an X post on August 3.
The warning signal came after XRP reached highs above $3.60, with the bearish cue suggesting that the latest rally could be running out of steam.
The 9-count TD Sequential signal, known for predicting trend exhaustion, appeared just as XRP approached a resistance zone between $3.60 and $4. Since then, prices have been sliding steadily, and the token is now approaching a key short-term support level.
At the same time, on-chain data shows that past accumulation behavior points to $2.80 as a temporary buffer for XRP, but real support begins below $2.48.
To this end, Martinez identified $2.40 as the critical zone to watch. If XRP continues to bleed lower, this level could act as a final line of defense for bulls to regroup. A failure to hold above $2.40 may open the door for deeper losses, possibly revisiting the $2.00 region.

XRP price analysis
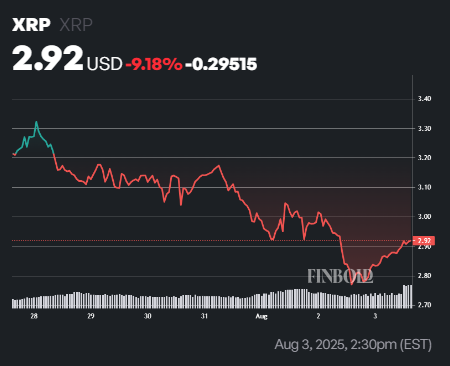
At press time, XRP was trading at $2.92, having rallied over 5% in the last 24 hours. On the weekly timeframe, however, the asset has plunged nearly 10%.
At the current value, XRP’s 50-day Simple Moving Average (SMA) of $2.65 shows the price is holding above the short-term trend, hinting at bullish sentiment. Meanwhile, the 200-day SMA at $1.875269 reflects a long-term upward trend.
Featured image via Shutterstock
