XRP Price Prediction for Today (April 25)

The XRP price barely moved today, but It did pumped 6% this week though. So, where could the XRP be headed today? Let’s find out.
XRP Chart Analysis
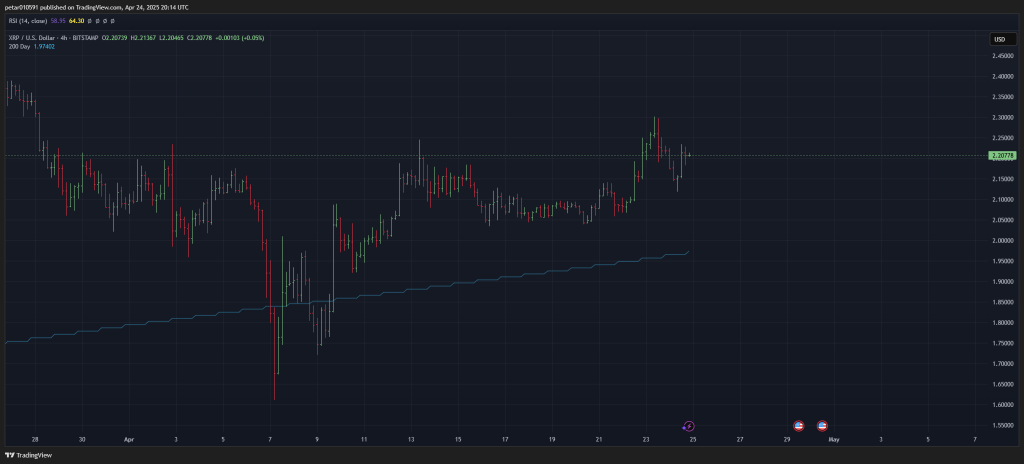
XRP is trading at about $2.21 right now. It recently tried to break above $2.24-$2.26 but couldn’t hold that level. The price has strong support at $2.05, with even stronger support at $1.97 where the 200-day moving average sits.
The chart shows higher lows forming, which suggests the uptrend might continue. After the big drop on April 7, XRP bounced back strongly and formed a rounded bottom. Since then, the price has been moving up steadily, showing a healthy recovery. The 200-day moving average is pointing up and acting as solid support around $1.97, which is important to watch if the market turns bearish.


Technical Indicators
The CCI stands at 126.86, putting it in overbought territory. This often means a short-term pullback could happen unless momentum keeps building.
The ADX is at 30.29, which shows a strong trend is forming. When ADX is above 25, it confirms the market is trending, in this case upward.
The Ultimate Oscillator reads 56.64, slightly bullish but not too hot. This suggests the uptrend is healthy and sustainable.
The ROC is 12.29, which is positive and strong. This means XRP has good momentum recently.
Bull/Bear Power sits at 0.1021, showing bulls have a slight edge in the market, but not complete control.
Read also: XRP Supply Chain Breach: Private Keys at Risk in Ripple Attack
XRP Price: Support/Resistance Zones
Key resistance levels to watch:
- First resistance: $2.24-$2.26 (recent high)
- Second resistance: $2.35 (resistance from early April)
Important support levels:
- First support: $2.05 (recent support after pullbacks)
- Second support: $1.97 (matches the 200-day moving average)
XRP Price Forecasts for Today
Bullish scenario: If the XRP price stays above $2.20 and trading volume increases, a break above $2.26 could push the price to $2.35-$2.40. With strong momentum, it might even test $2.50 before the week ends.
This bullish move could happen if:
- XRP breaks above $2.26 with strong volume
- The RSI stays below overbought (currently at 64)
- The uptrend continues, confirmed by ADX above 30 and rising ROC
Bearish scenario: If the XRP price falls below $2.17-$2.15, especially with higher selling volume, XRP could retest the $2.05 support. A sharper drop might bring it back to the 200-day moving average around $1.97, especially if market news turns negative.
Watch for these bearish signals:
- CCI dropping from overbought levels
- Failed attempts to break above $2.26
- Decreasing volume or reversal candle patterns forming
Follow us on X (Twitter), CoinMarketCap and Binance Square for more daily crypto updates.
Get all our future calls by joining our FREE Telegram group.

We recommend eToro
Active user community and social features like news feeds, chats for specific coins available for trading.
Wide range of assets: cryptocurrencies alongside other investment products such as stocks and ETFs.
Copy trading: allows users to copy the trades of leading traders, for free.
User-friendly: eToro’s web-based platform and mobile app are user-friendly and easy to navigate.

