XRP Price Prediction for Today (August 10)

Ripple’s XRP is still stuck in a range after failing to break above the descending trendline from the July high. It’s trading around $3.27, down just over 1% in the past day. The move comes as traders react to Ripple’s large escrow release and some notable whale selling.
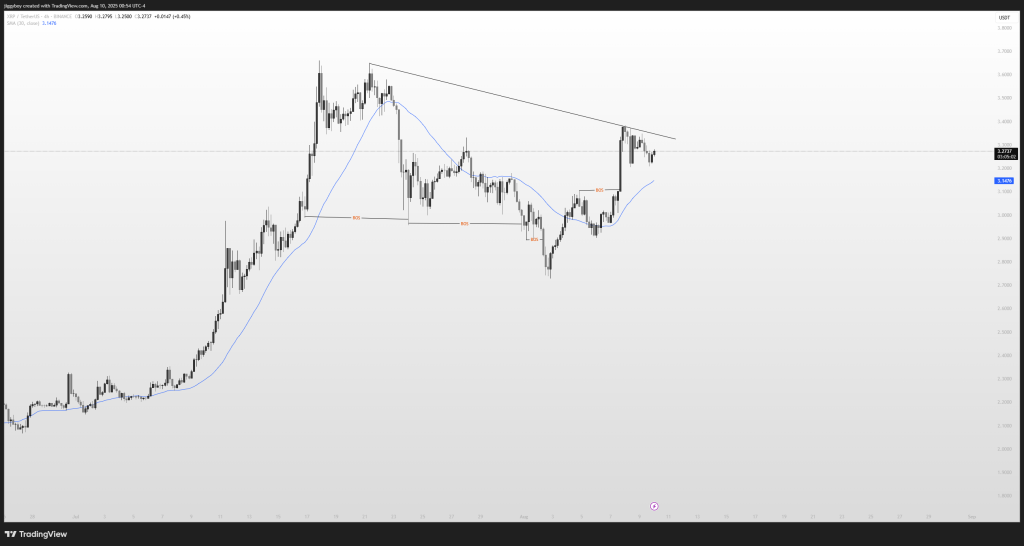
After bouncing off the early August lows near $2.90, XRP price pushed up to $3.40 before running into resistance. Right now, it’s holding above the 50 SMA but hasn’t managed a clear breakout yet.
Let’s break down what’s happening today.
📅 What We Got Right Yesterday
Yesterday we pointed out that $3.40 was the breakout level to watch, while $3.00 was the key support.
That’s pretty much how it played out. XRP Price failed to close above $3.40 and dipped slightly, but buyers stepped in at $3.14, which lines up with the 50 SMA and the recent breakout retest. Sellers are still defending the trendline, but buyers aren’t giving up support either.
📊 XRP Daily Overview (August 10)
- Current Price: $3.27
- 24h Change: -1.05%
- 4H RSI (14): 50.85 – neutral momentum
- Volume: Down over 20%
The XRP price remains capped below the $3.40–$3.43 zone. Support sits at $3.14–$3.15, then $2.90–$2.95. The broader downtrend from mid-July is still in place, but holding above the 50 SMA keeps short-term momentum steady.
Read Also: Pi Network’s Big Supply Bet: Why 100B Tokens Could Be the Key to Mass Adoption
🔍 What the XRP Chart Is Showing
The 4H chart shows that big push in mid-July to above $3.70, followed by a drop that broke several support levels. Early August saw a strong recovery and a move back above the 50 SMA, but the descending trendline hasn’t been broken yet.
Resistance is clear at $3.40–$3.43, then $3.55–$3.60, and $3.70–$3.75. If XRP price slips under $3.14, it could head for $2.90 or even lower.


📈 Technical Indicators (Hourly Timeframe)
| Indicator | Value | Interpretation |
|---|---|---|
| MACD (12,26) | -0.015 | Bearish crossover, momentum slowing |
| ADX (14) | 36.17 | Strong trend strength |
| CCI (14) | 26.67 | Neutral deviation |
| RSI (14) | 50.85 | Balanced momentum |
| ROC | -0.73 | Mild downside bias |
| Bull/Bear Power (13) | -0.0025 | Buyers showing early signs of control |
Summary: The signals are mixed. ADX and Bull/Bear Power suggest buyers are still in the game, but MACD and ROC point to short-term selling.
🔮 XRP Price Prediction Scenarios
Bullish:
Clean breakout above $3.43 will trigger a move towards $3.55 and $3.70, with $3.75 as the next level if momentum is sustained.
Neutral:
If $3.40 continues to hold as resistance, XRP price can remain range-trapped between $3.00 and $3.40, with sellers still buying dips and selling rallies.
Bearish:
A drop to below $3.00 would step up losses towards $2.80, and in the case of failure there, $2.55 would be the next important support to test.
🧠 Wrapping Up
XRP price is still in a standoff between buyers and sellers under that key trendline. Support is holding, but without a break over $3.43, momentum will stay limited.
For now, the most likely outcome is more sideways action between $3.00 and $3.40, with traders watching $3.14 and $3.40 to see which side wins next.
Subscribe to our YouTube channel for daily crypto updates, market insights, and expert analysis.

