XRP price has been climbing slowly but steadily since bouncing off its major support zone in late June. Trading volume is picking up, and there’s some bullish momentum building, but the $2.30 resistance level is still holding strong.
After that $1.90 to $2.00 bounce, the price is now trading just over $2.26. It’s closely following a rising trendline and continues to stay above the 50-period moving average, which is currently good support.
Let’s take a closer look at today’s setup.
📊 XRP 4H Overview (July 7)
- Current Price: $2.2655
- 24h Change: +1.79%
- 4H RSI (14): 53.99
- Volume: Up 126%
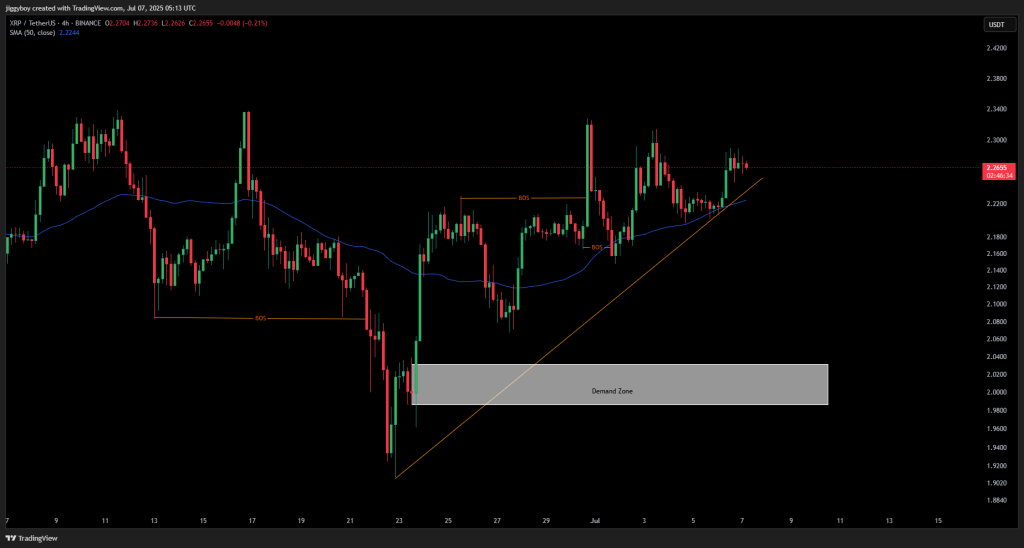
XRP price continues to trade above the 50 SMA at $2.2244, supported by a clean uptrend structure and demand interest around $2.00. The price structure remains bullish as long as it stays above this moving average and the ascending trendline.
Short-term resistance lies near $2.30 and $2.42. If XRP breaks these levels with volume, the next upside target could be around $2.50. On the downside, $2.22 and $2.15 are minor supports before the $2.00 demand zone.
🔍 What the XRP Chart Is Showing
The chart shows three Breaks of Structure (BOS) since mid-June, indicating a shift from bearish to bullish momentum. Buyers have done a good job holding the line, stepping in to defend each dip and keeping XRP on that upward trendline that started around June 23.
Right now, XRP price is hanging just under a key resistance level. It’s more of a slow grind than a breakout, signs of consolidation are clear. Volume has picked up, which suggests accumulation, but unless XRP can break above $2.33 with some strength, that momentum could start fading.
The $2.00–$2.05 zone remains a critical demand area. If the price breaks below the trendline and the 50 SMA, a return to this zone is likely.
📈 Technical Indicators (Hourly Timeframe)
| Indicator | Value | Signal / Interpretation |
| MACD (12,26) | 0.008 | Mild bullish crossover, upward bias |
| RSI (14) | 53.994 | Neutral momentum |
| CCI (14) | -48.37 | Slightly bearish, neutral zone |
| Ultimate Oscillator | 41.693 | Bearish pressure building |
| ROC (Rate of Change) | -0.474 | Mild negative price movement |
| Bull/Bear Power (13) | 0.0002 | Weak bullish edge |
Summary: The indicators present a mixed picture. Momentum remains limited, but the structure leans slightly bullish. There are no signs of a strong breakout or breakdown yet.
🔮 XRP Price Prediction Scenarios
Bullish Scenario:
A break above $2.33 on volume could spark a move toward $2.50. Volume is building, but no breakout confirmed.
Neutral Scenario:
XRP price may continue consolidating between $2.22 and $2.30 as buyers and sellers compete near resistance.
Bearish Scenario:
Failure to hold the trendline and 50 SMA could send XRP back to test the $2.00 demand zone.
🧠 Wrapping Up
XRP price is holding its uptrend and trading above key supports, but faces stiff resistance near $2.30. The indicators are mixed, with MACD and structure leaning bullish while momentum tools show mild weakness.
The most likely outcome today is a continuation of the sideways pattern between $2.22 and $2.30 unless volume drives a clean breakout.
Read Also: 75% of KAS Unmoved for 3+ Months – Can Scarcity Drive Kaspa Price Higher?
Subscribe to our YouTube channel for daily crypto updates, market insights, and expert analysis.

