XRP price is trading just above the 50-day Simple Moving Average, hovering near $2.28. However buyers have shown mild interest, but it’s not enough to force a breakout above key resistance.
The price has climbed from under $2.10 to its current level in the past two weeks, showing signs of recovery.
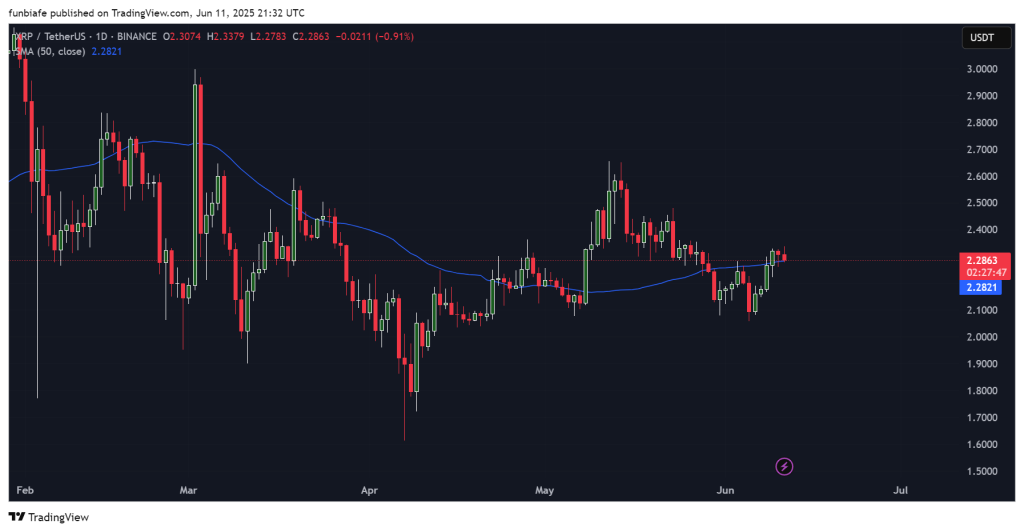
Still, XRP has yet to post a clear close above the $2.30 level, which would be needed to confirm any sustained upside.
Meanwhile, the volume remains muted and the technical indicators show that sellers are not entirely out of the picture.
Let’s take a look at what the daily indicators are revealing about XRP’s momentum.
XRP Indicator Readings on the Daily Chart
| Name | Value | Action |
| RSI (Relative Strength Index) | 41.456 | Weak momentum, bearish |
| MACD (12,26) | -0.002 | Negative crossover, bearish |
| CCI (Commodity Channel Index) | -151.8361 | Oversold zone, bearish |
| Stochastic Oscillator (9,6) | 31.947 | Low reading, leaning bearish |
| Ultimate Oscillator | 35.993 | Weak momentum, bearish |
| ATR (Average True Range) | 0.0202 | High volatility, wide price swings |
Most indicators are still pointing to downside pressure. Momentum is weak, and there’s no strong buying signal yet.
The CCI reading suggests XRP is trading well below its average price, while the Stochastic and RSI are stuck in neutral-to-bearish zones. The ATR shows increased volatility, which may lead to sharper intraday moves in either direction.
What the Moving Averages Tell Us
Short-term and mid-term moving averages present a mixed picture. The 20-day and 50-day simple moving averages are signaling Sell, with XRP price sitting near or slightly below those levels.
This shows short-term resistance is still holding. However, the 100-day and 200-day moving averages are offering Buy signals.
This suggests that while short-term momentum is stalling, the longer-term outlook may be improving. XRP price has not yet broken out above the 50-day SMA, which remains the key level to watch.
XRP Price Prediction for Today (June 12)
Bearish Case: If XRP slips below $2.25, there’s a good chance it could drift back toward the $2.20 support zone. That move would likely be fueled by more selling pressure or if the overall crypto market starts turning weaker again.
Realistic Case: XRP price may remain between $2.25 and $2.35 today. This would reflect continuation of the current range-bound behavior while waiting for volume or external catalysts.
Bullish Case: If XRP closes above the $2.30–$2.35 resistance zone with strong volume, a push toward $2.40 or even $2.50 is possible. A confirmed breakout would mark a shift in momentum.
Read Also: FLOKI Price Reclaims Key Zone – Is a 25% Rally Coming?
At this stage, the trend remains neutral. A clear break above $2.35 would be the first sign of renewed strength, but unless that happens with volume, XRP price is likely to keep moving sideways.
Subscribe to our YouTube channel for daily crypto updates, market insights, and expert analysis.

We recommend eToro
Active user community and social features like news feeds, chats for specific coins available for trading.
Wide range of assets: cryptocurrencies alongside other investment products such as stocks and ETFs.
Copy trading: allows users to copy the trades of leading traders, for free.
User-friendly: eToro’s web-based platform and mobile app are user-friendly and easy to navigate.