XRP Price Prediction for Today (June 15): Will Range-Bound Action Continue or Signal a Breakout?
XRP price has been stuck in a tight range between $2.05 and $2.30 since mid-May, with the price getting rejected every time it tries to break above the descending resistance line. That’s exactly what we expected in yesterday’s outlook, unless there’s a spike in volume or some big market shift, the price isn’t likely to break out just yet.
So far, that’s held true. The price continues to bounce between support and resistance, but without any real momentum. Buyers have stepped in around the $2.05–$2.10 area more than once, but each time XRP tries to climb higher, it stalls before hitting $2.30. We’re also seeing a pattern of lower highs, which suggests sellers are stepping in earlier on every attempt.
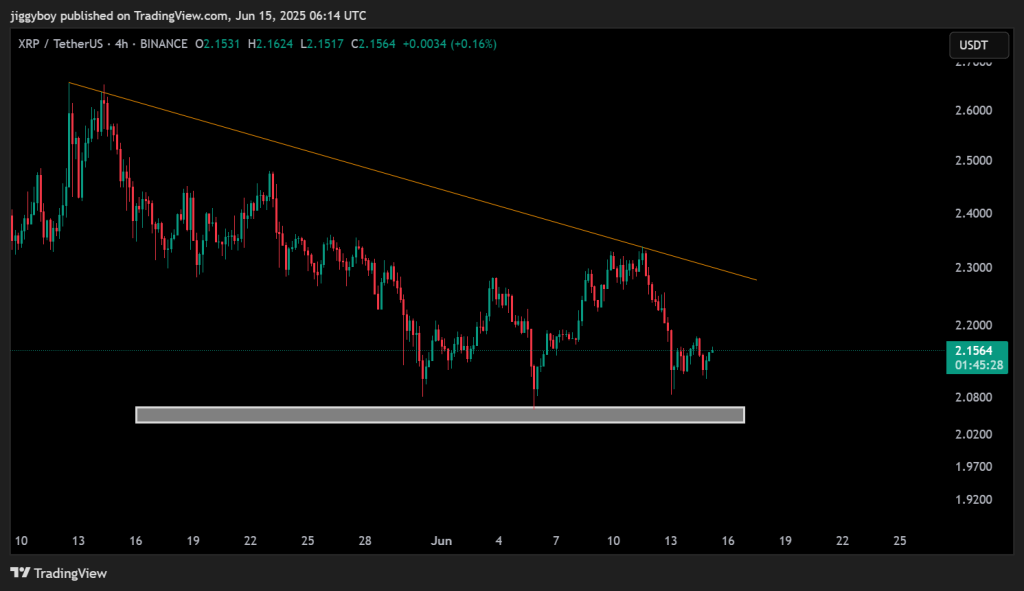
At writing, XRP price is trading around $2.15, and volume is down by 35%. That drop in activity shows traders are mostly sitting on the sidelines, which helps explain why price action has been so flat.
Read Also: How Much Could XRP Be Worth If Ripple Files for an IPO? An Expert’s Perspective
XRP Indicator Readings on the Hourly Chart
| Name | Value | Action |
| RSI | 54.742 | Neutral, market equilibrium |
| STOCH | 81.742 | Overbought, potential short-term pullback |
| MACD | 0.003 | Bullish crossover forming, fading sell pressure |
| CCI | 124.4092 | Bullish deviation, strong short-term strength |
| ATR | 0.0116 | Low volatility, tight trading range |
| Ultimate Oscillator | 62.427 | Steady buying interest, bullish momentum building. |
Right now, most signals are leaning bullish, but not screaming it. The MACD, CCI, and Ultimate Oscillator are all hinting at some upward momentum building up. That said, the Stochastic Oscillator is flashing “overbought,” so don’t be surprised if we get a quick dip before any real move up.
The RSI? Chilling at 55, totally neutral. The market’s stuck in that “I dunno, you pick” phase. And with the ATR still low, price action’s stuck in snooze mode, tight, slow, and boring.
What the Moving Averages Indicate
Across daily timeframes, moving average signals present a mixed outlook. The 20-day and 50-day lines are sitting below the current price. This gives XRP price a slight bullish edge in the short term.
The longer-term picture still looks bearish because the 100-day and 200-day moving averages are sitting well above the current price. XRP would need to break above those levels and stay there to really change the momentum.
XRP Price Outlook for June 15
Bearish Case:
If XRP loses $2.05 on the 4H chart, brace for a slide toward $2.00, maybe even $1.95 if volume picks up. That’d confirm the bears are still lurking.
Realistic Case:
Without big news or a strong volume spike, expect more of the same, $2.10 to $2.30 range, with all the excitement of watching paint dry.
Bullish Case:
If XRP breaks above the descending trendline near $2.30 with strong volume, a rally toward $2.40 may develop. However, this scenario remains dependent on improved momentum and market participation.
For now, XRP price remains stuck in its familiar range. It’ll take a clean breakout above or below the current levels to shift sentiment and trigger the next move.
Subscribe to our YouTube channel for daily crypto updates, market insights, and expert analysis.

We recommend eToro
Active user community and social features like news feeds, chats for specific coins available for trading.
Wide range of assets: cryptocurrencies alongside other investment products such as stocks and ETFs.
Copy trading: allows users to copy the trades of leading traders, for free.
User-friendly: eToro’s web-based platform and mobile app are user-friendly and easy to navigate.

