
Crypto Twitter lit up this morning after chart analyst @WorldOfCharts1 shared a new 12-hour XRP/USDT setup – and many traders are now watching the same levels closely. The chart, posted July 6, outlines a potential breakout and retest zone that could hint at XRP’s next big move.
Right now, XRP is trading around $2.26, and the chart shows it retesting the key 2.15–2.35 zone. This area has acted as both support and resistance for weeks. Earlier, XRP got rejected at a descending trendline that’s been pressing down on price since May. Now it’s bouncing back and trying to hold its ground above the zone it just broke out of.
If XRP manages to stay above $2.15 and then push past $2.35 with volume, this could confirm the breakout. Many traders view this setup – breakout, retest, continuation – as a bullish pattern, especially when it happens on a 12-hour timeframe.
What the XRP Chart Suggests
The setup points to a possible recovery toward the $3.10–$3.20 range if this bounce holds. That would be a clean 35% move from current levels. A green candle showing 2.29% gains right after the retest is a promising sign. But this move still needs confirmation with a strong close above the resistance zone.
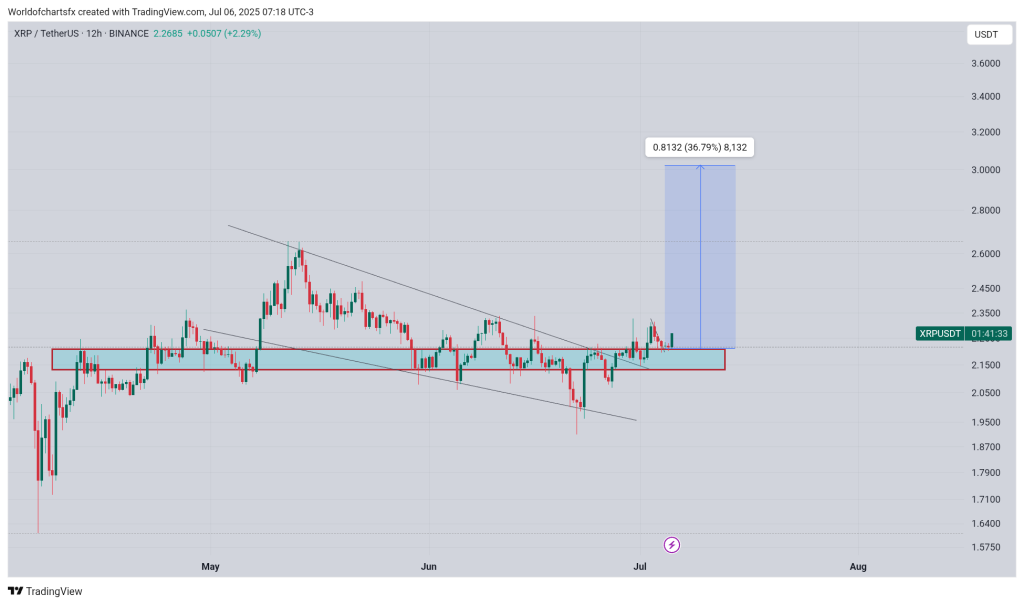
However, the focus now is firmly on whether XRP can reclaim the $2.35 level.
What Happens If Support Fails?
There’s always the bearish scenario. If the $2.15 level doesn’t hold, XRP could fall back toward $2.00 or even as low as $1.95 – which acted as a base back in May. The recent rejection from the trendline shows sellers haven’t completely disappeared, so bulls still have work to do.
Of course, there’s a middle path too: XRP could keep chopping inside the $2.15–$2.35 range for a while longer, consolidating before deciding its next direction. That wouldn’t be ideal for fast trades, but it would keep the broader bullish structure intact.
The next few candles on the 12-hour chart will be key. If XRP can close above $2.35 with strength, that would flip resistance into support and open the door to higher levels. But if it fades back below $2.15, the breakout might have been a fakeout.
For now, the chart’s structure favors the bulls – but only if they can follow through.
Read also: Will a $10,000 XRP Break the Ledger It Was Built On? Some Say Yes, Others Disagree
Subscribe to our YouTube channel for daily crypto updates, market insights, and expert analysis.

